

Data Visualization on an Orange
Project description
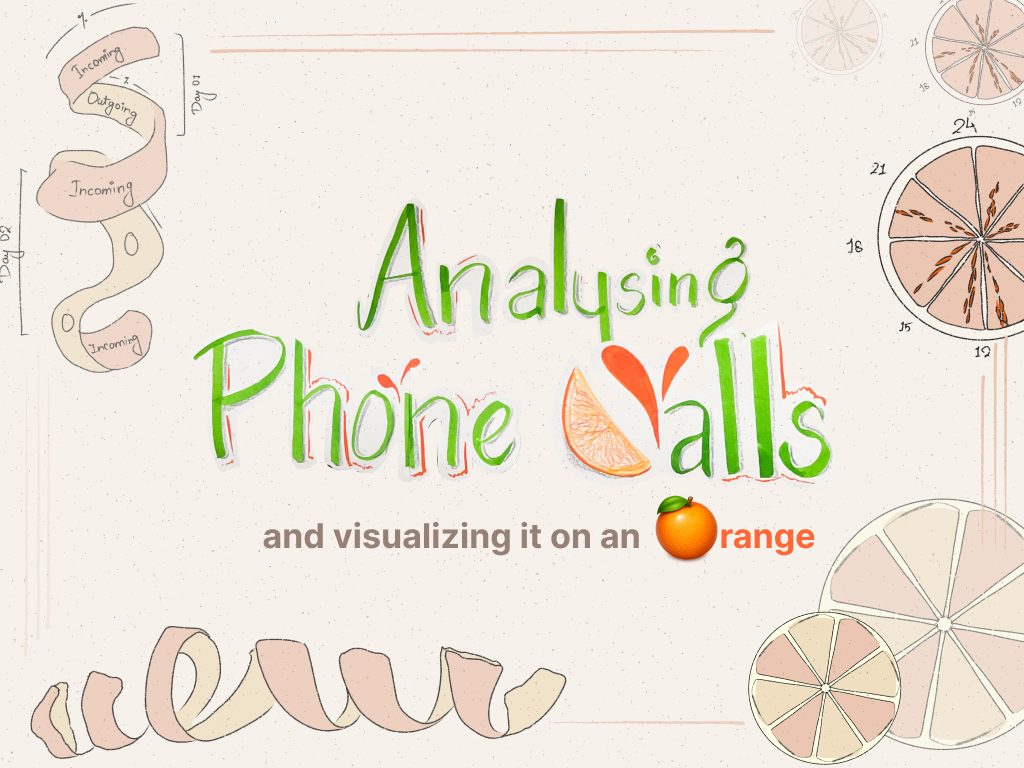
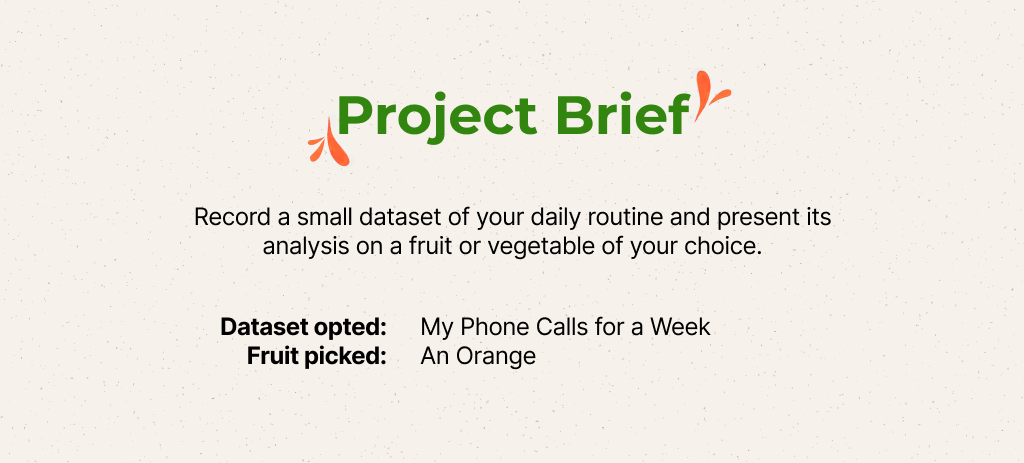
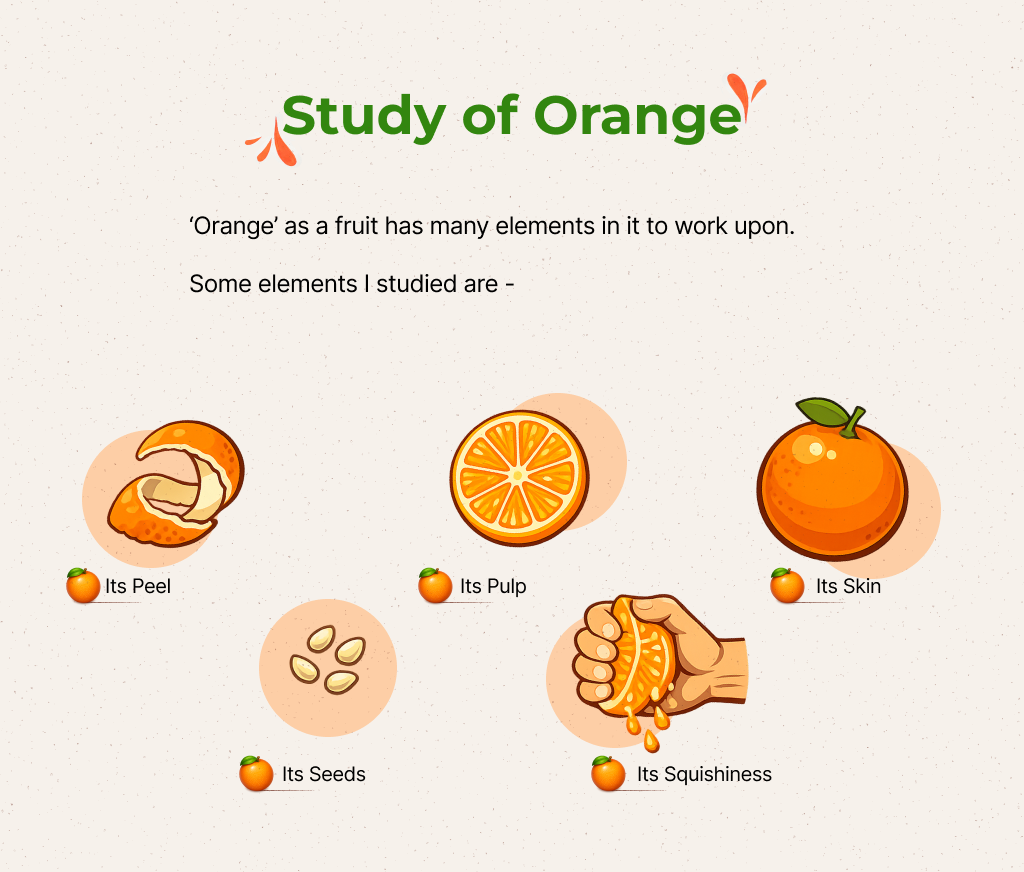
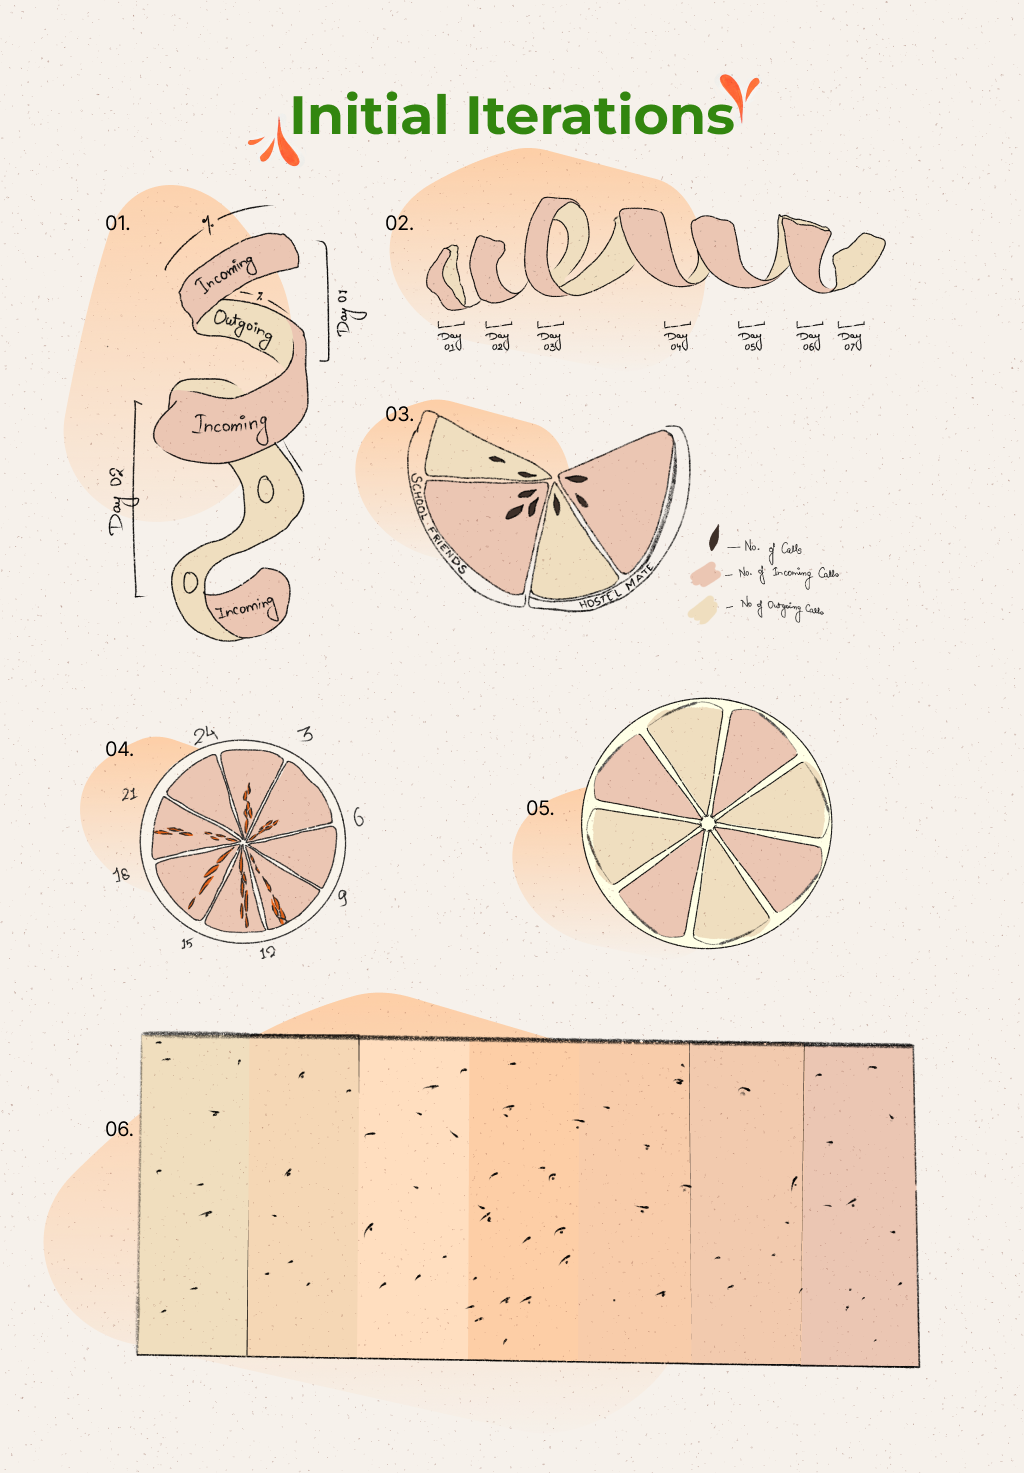
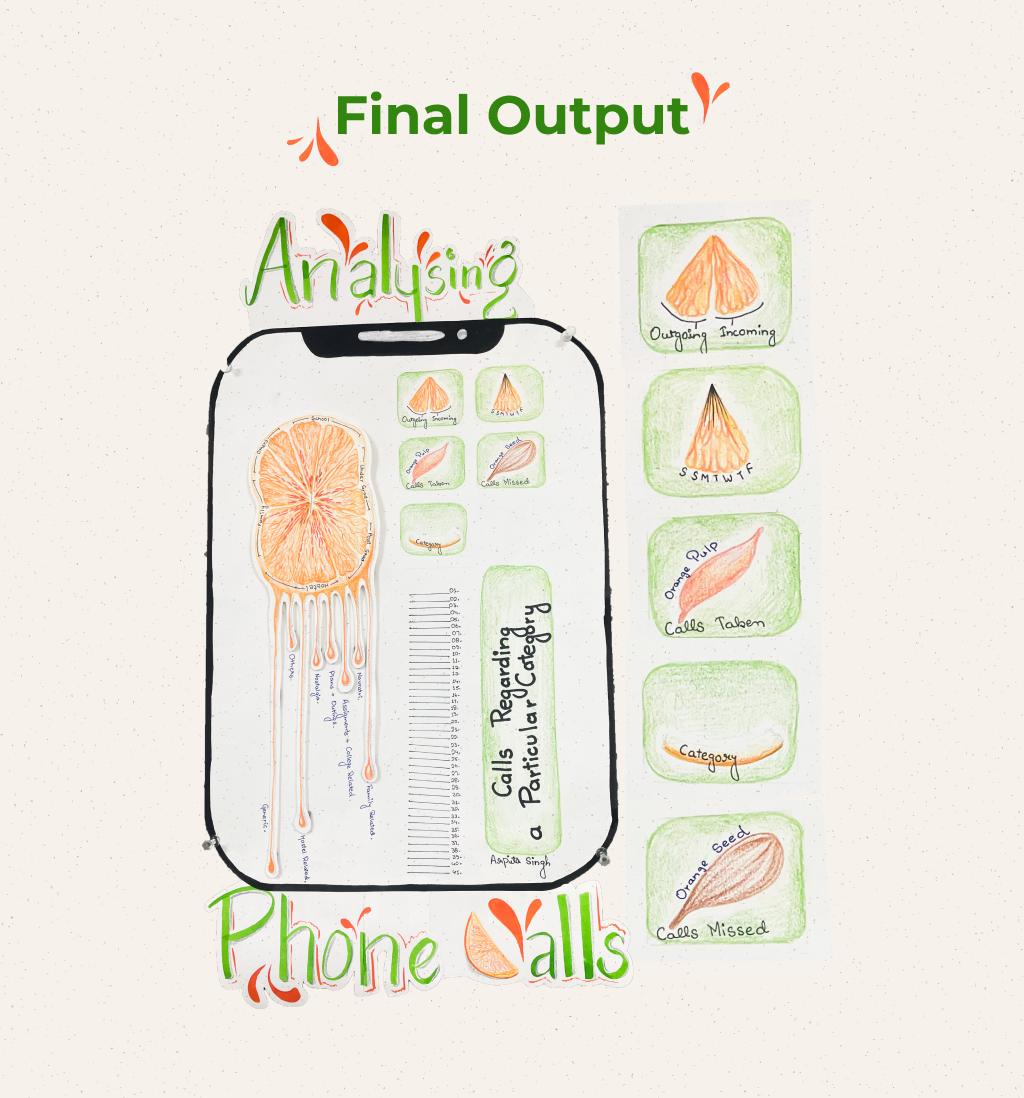
Analysing Phone Calls — Data Visualization on an Orange A week of personal phone call data, mapped onto the anatomy of an orange. Each part of the fruit encodes a different data dimension — pulp for calls taken, seeds for missed calls, the peel for incoming vs. outgoing patterns across the week. Six iterations led to a final hand-drawn infographic poster that blends data art with analog illustration. Intimate data, unexpected medium, honest outcome. Tools: Hand drawing, colored pencil, digital layout Category: Data Visualization / Information Design

Support this project
Be the first to upvote