 PRO
Enigma - AI Agent Dashboard Traces
VIDEO
Project description
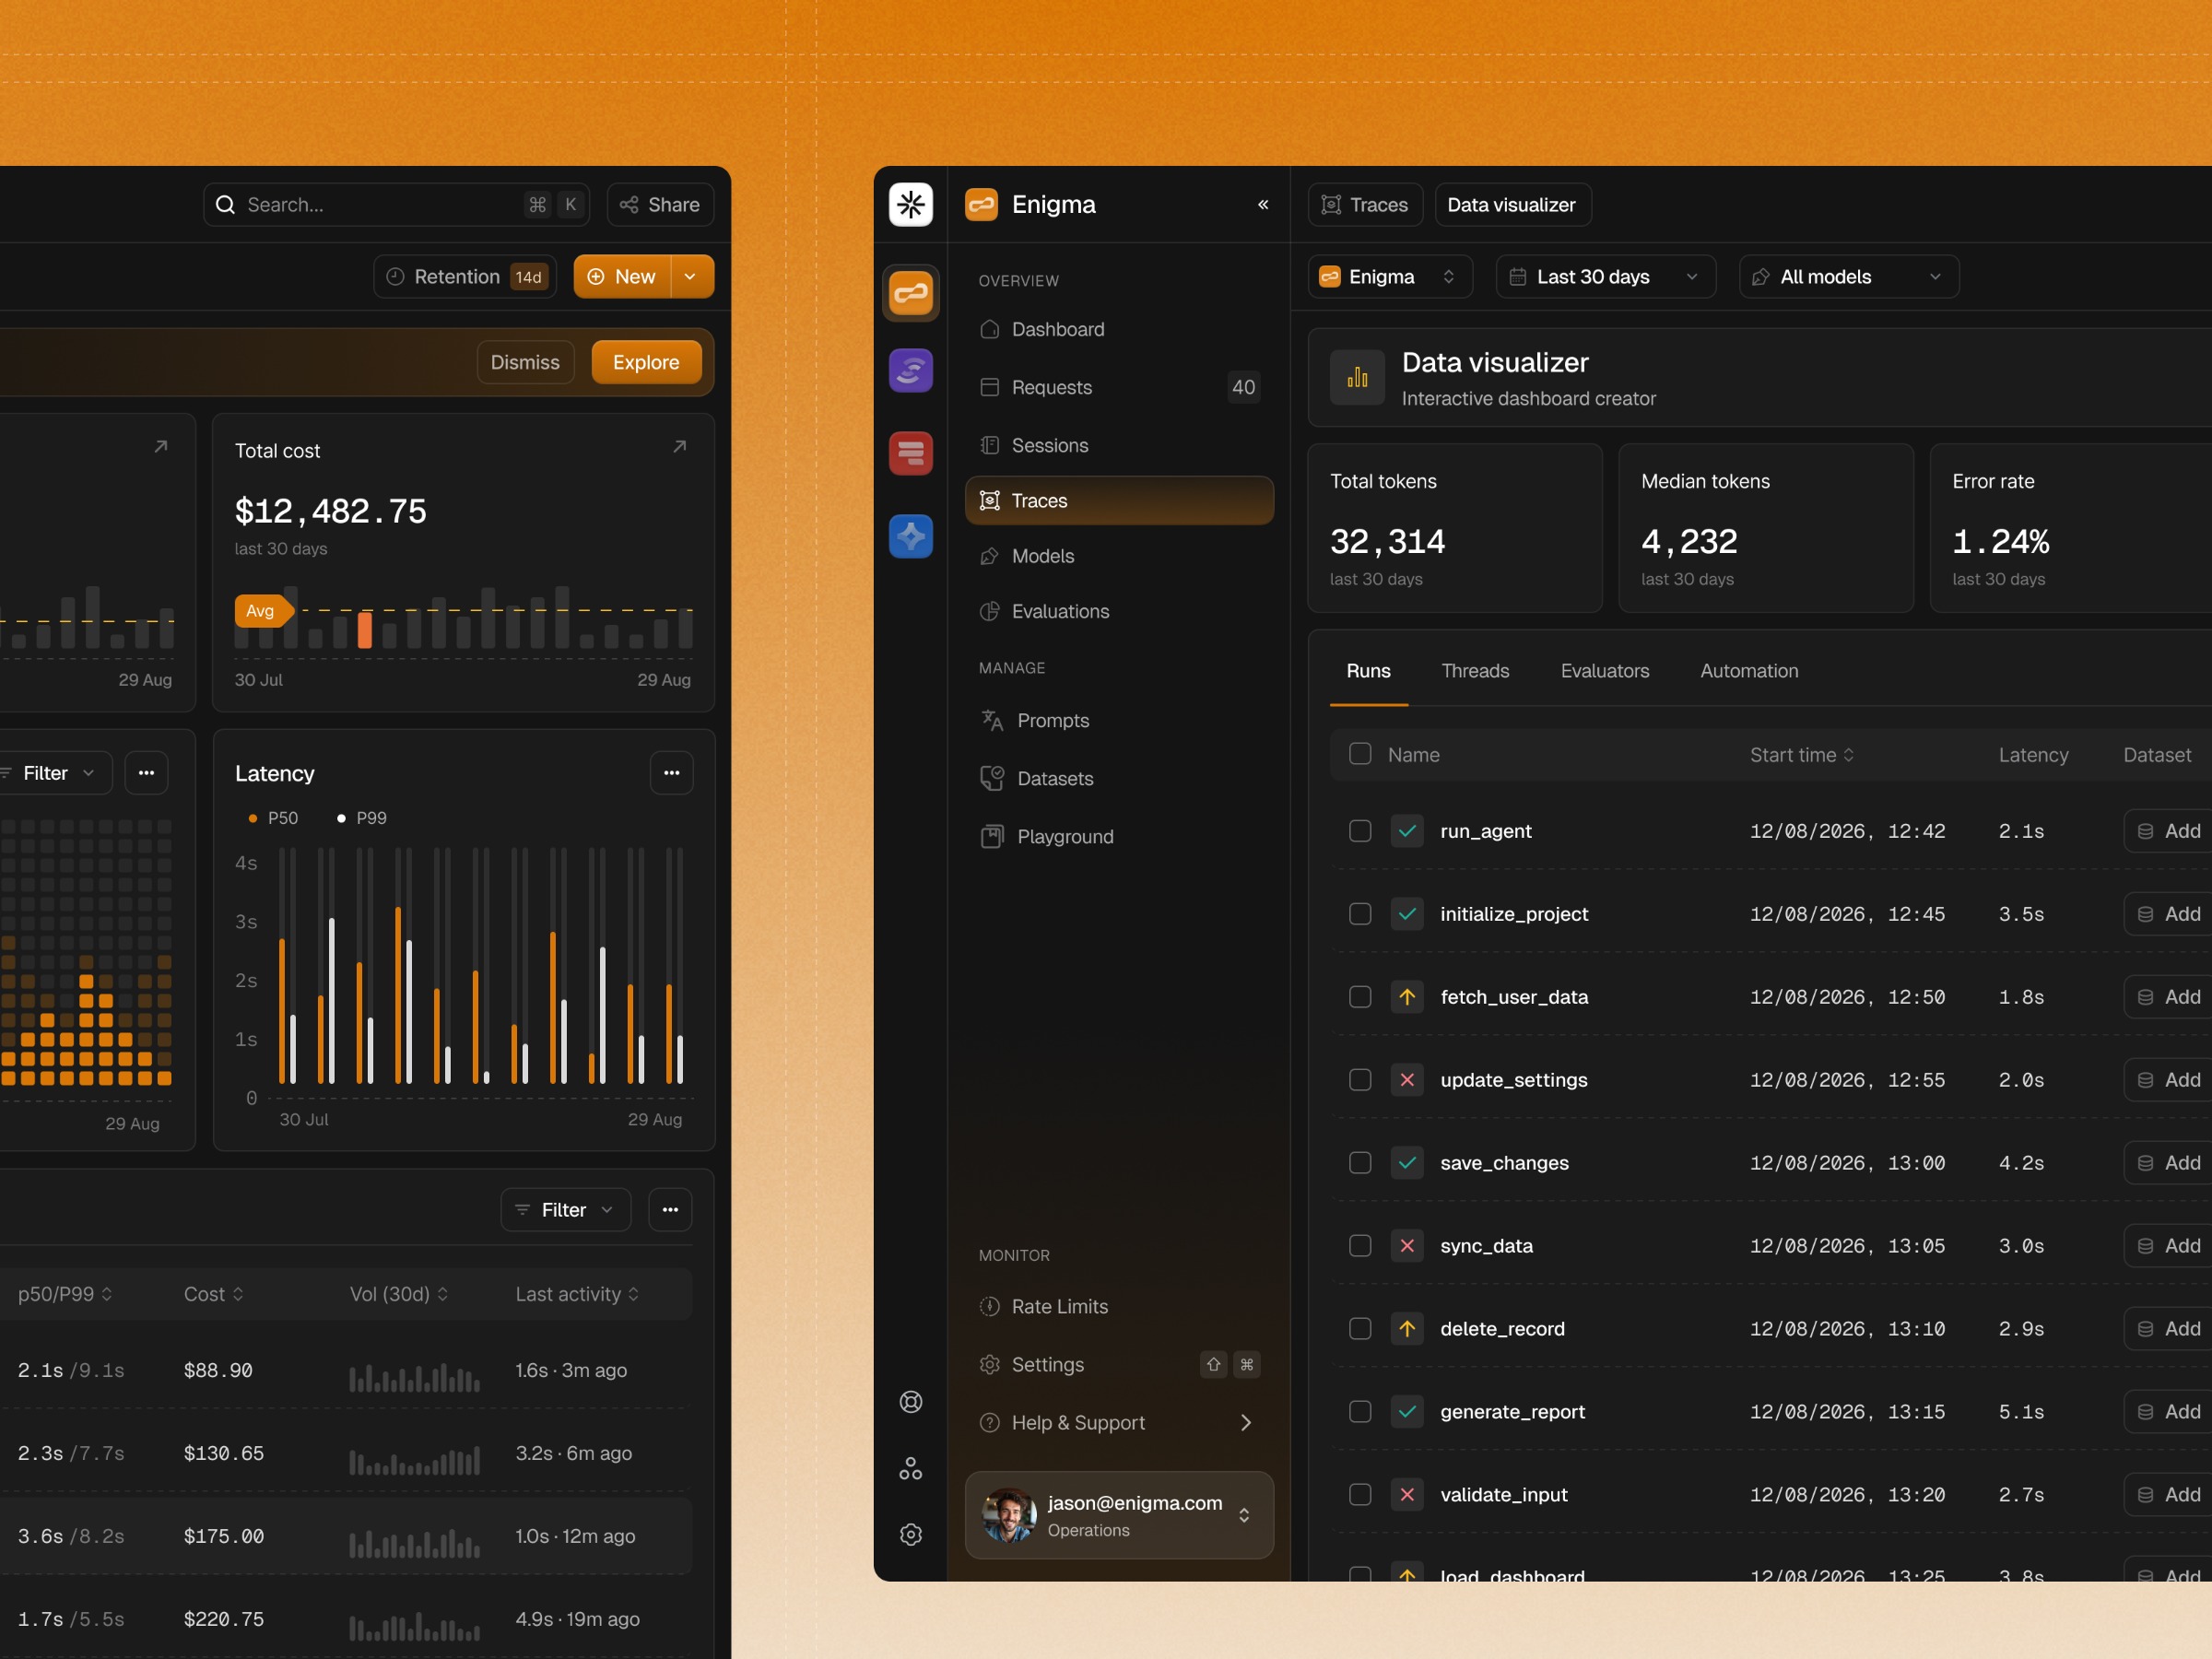
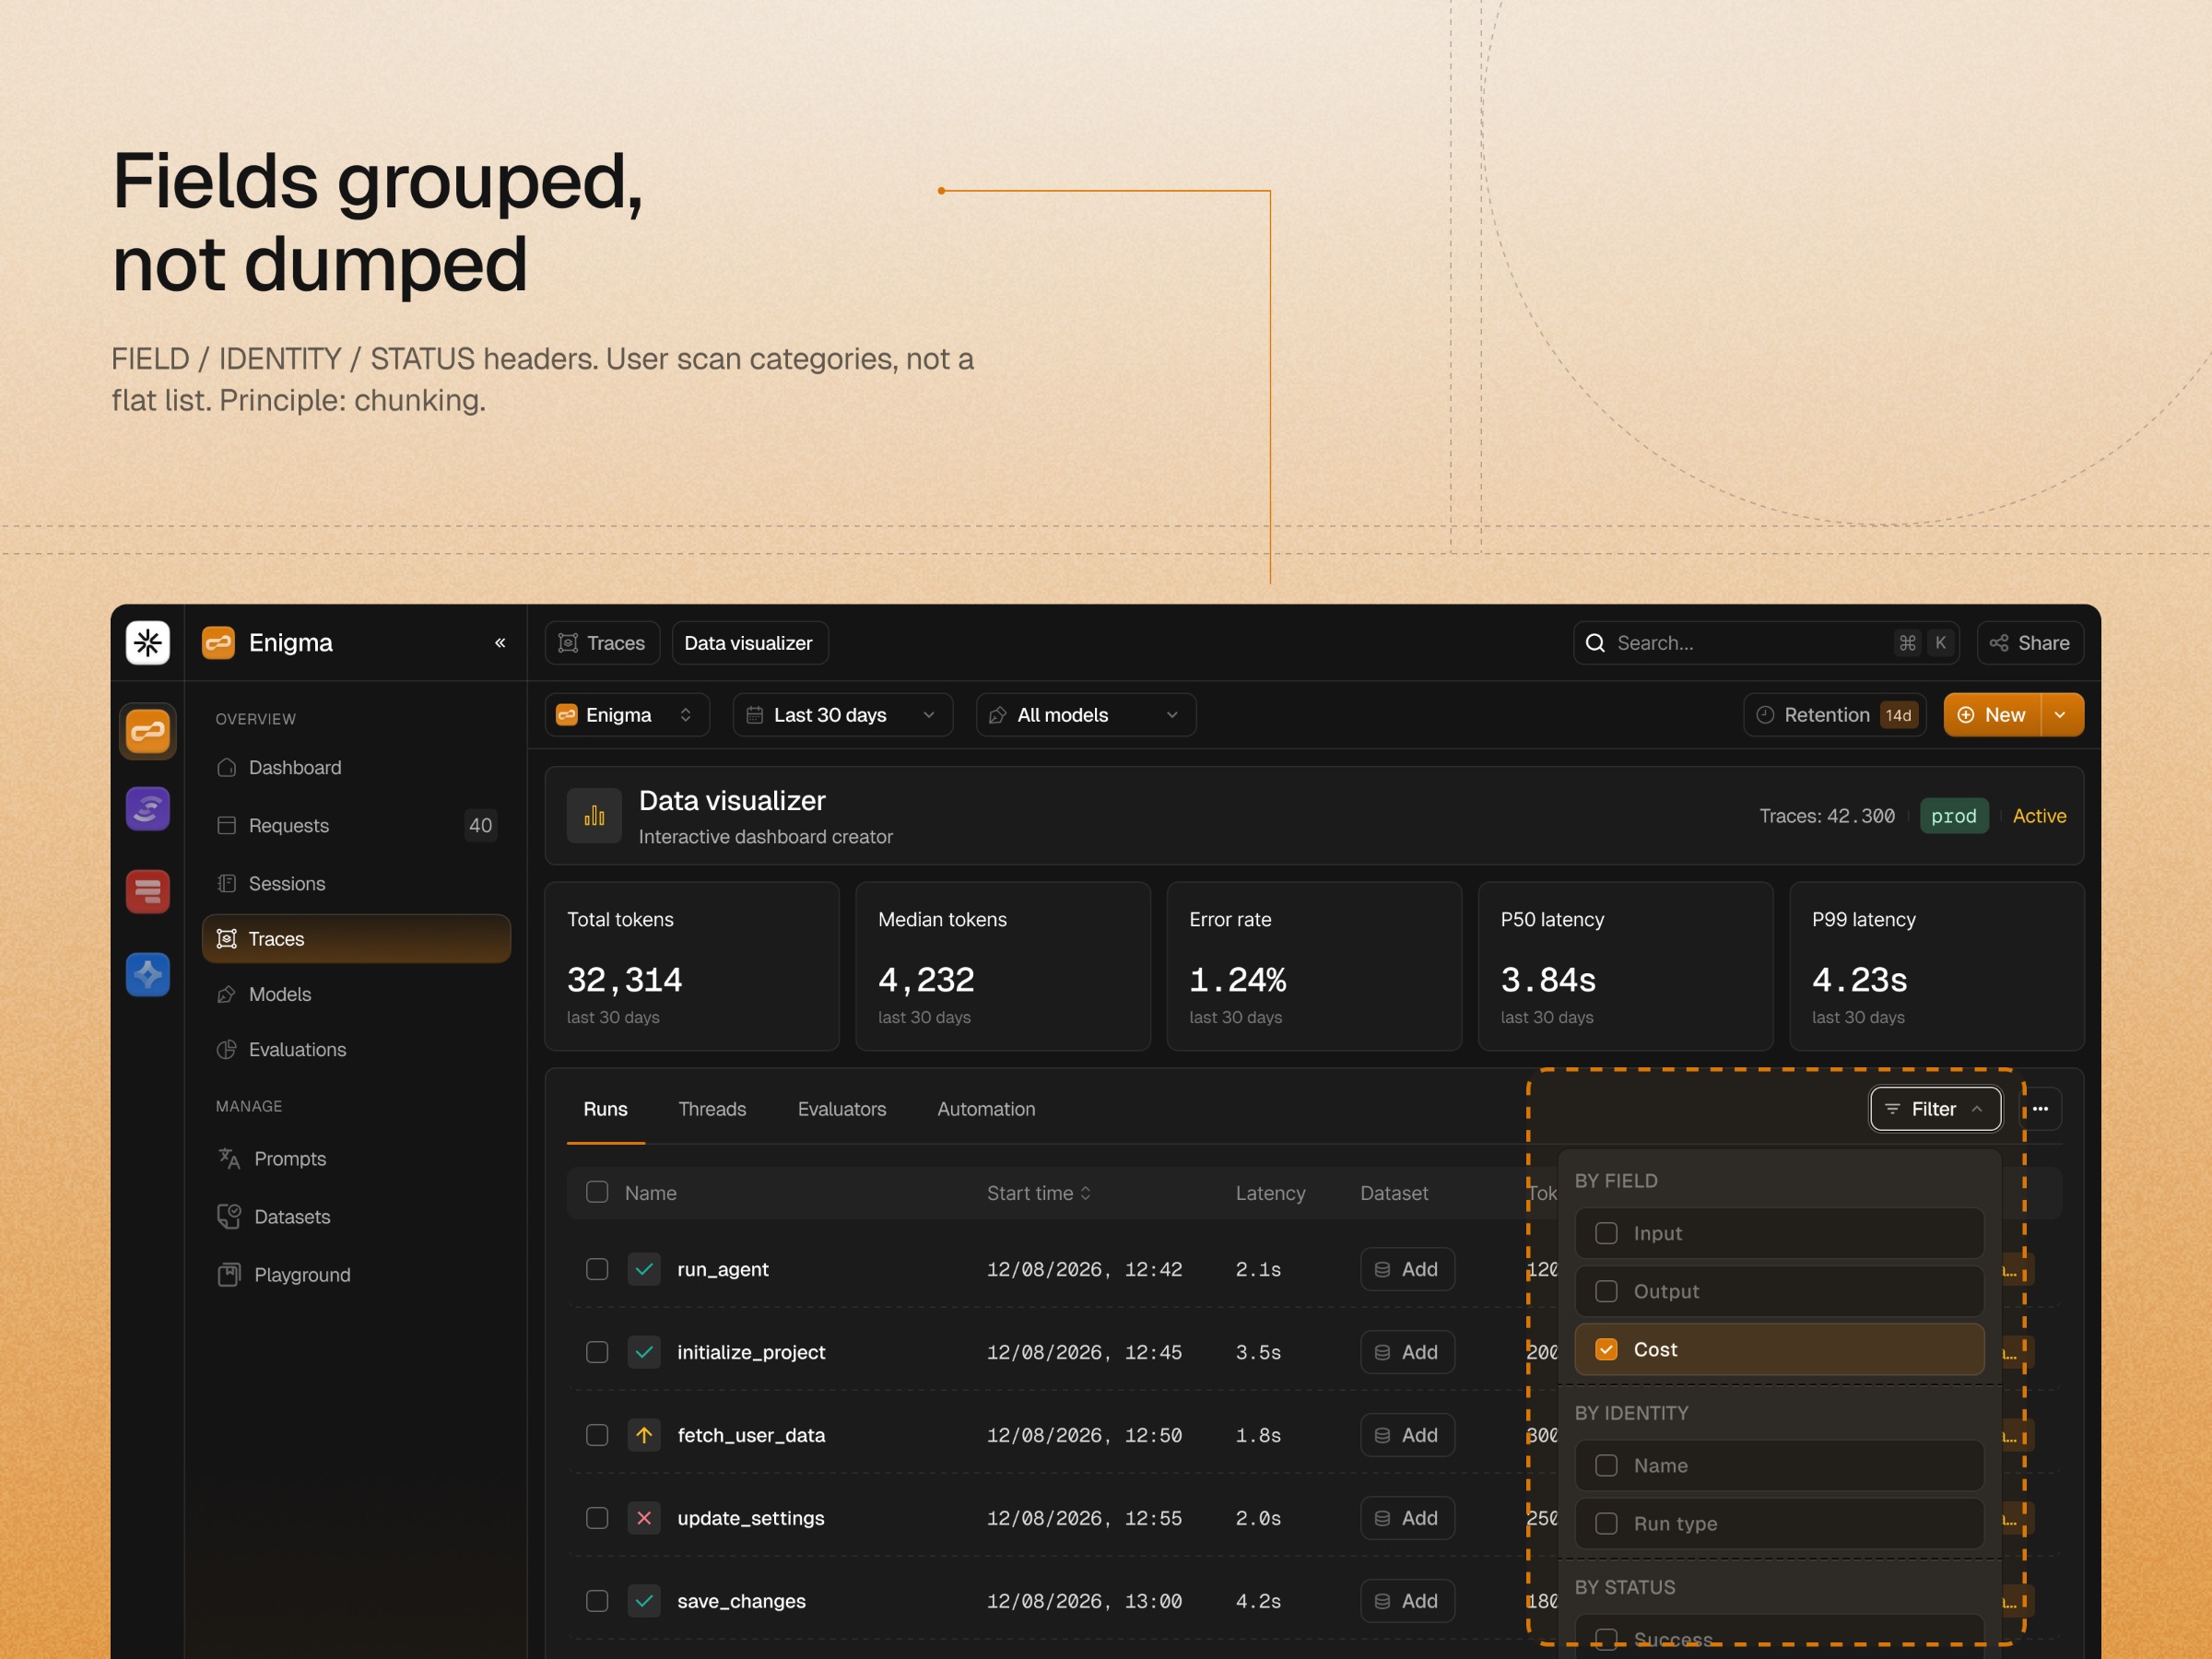
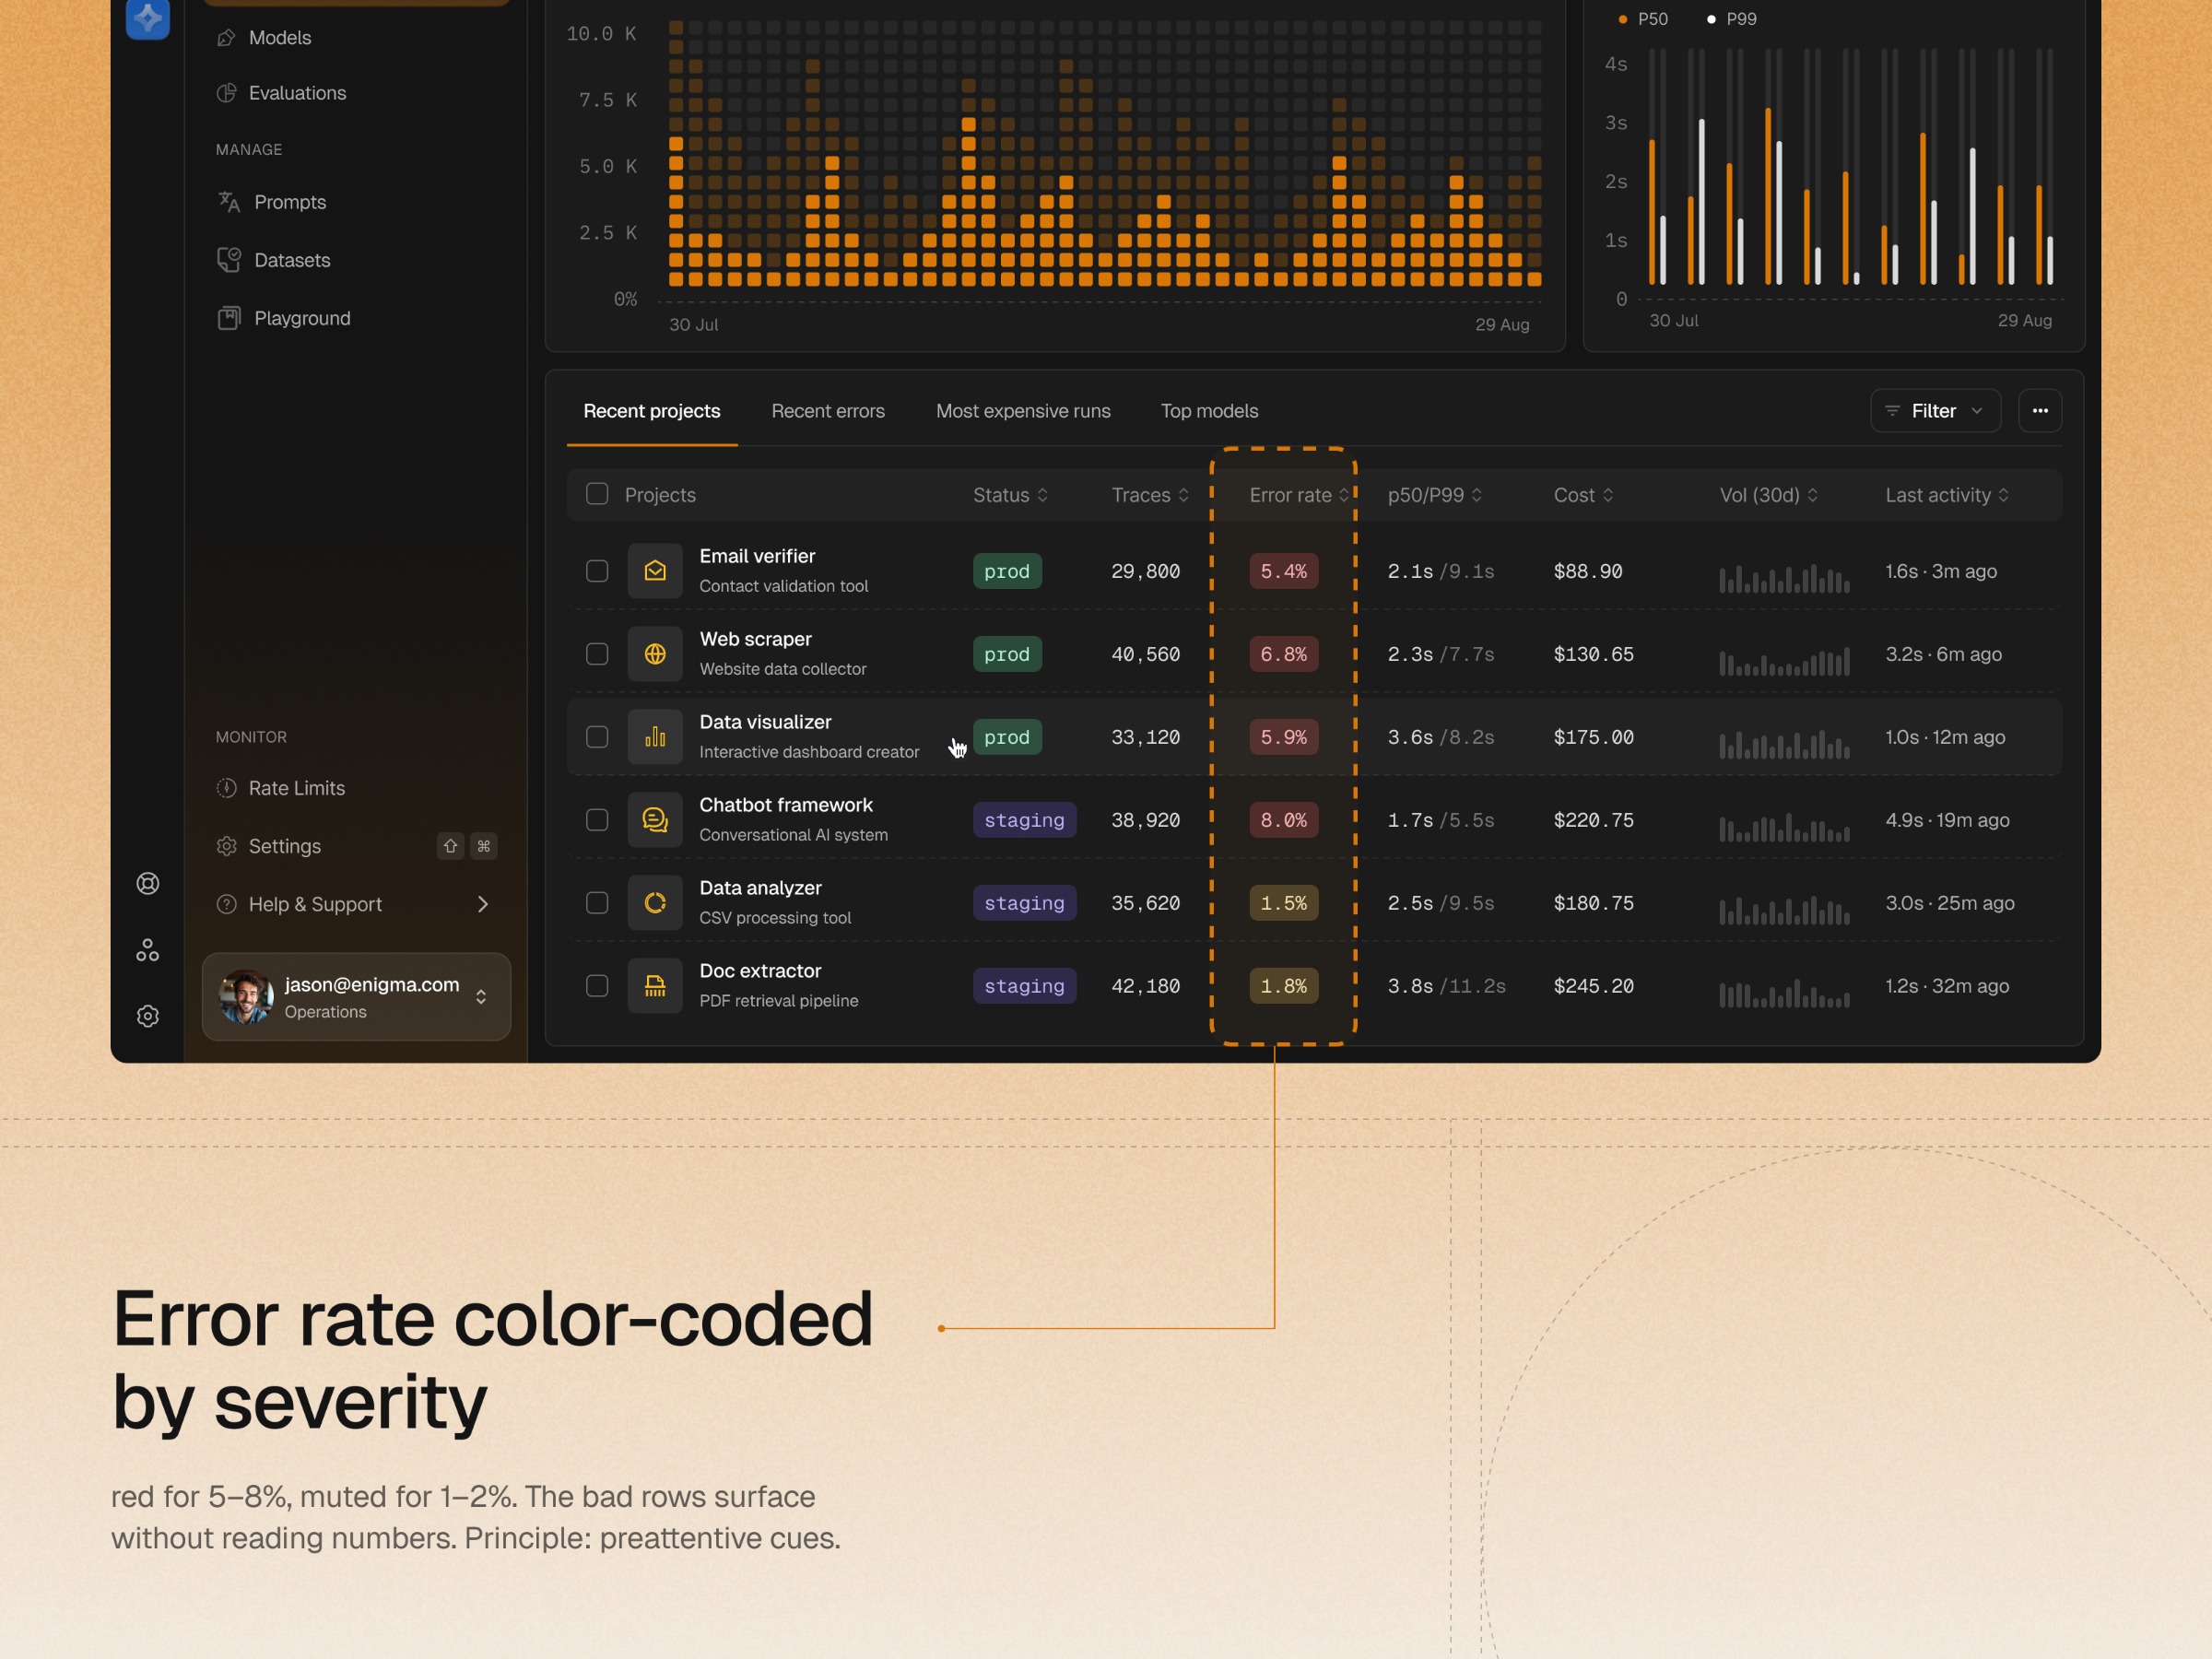
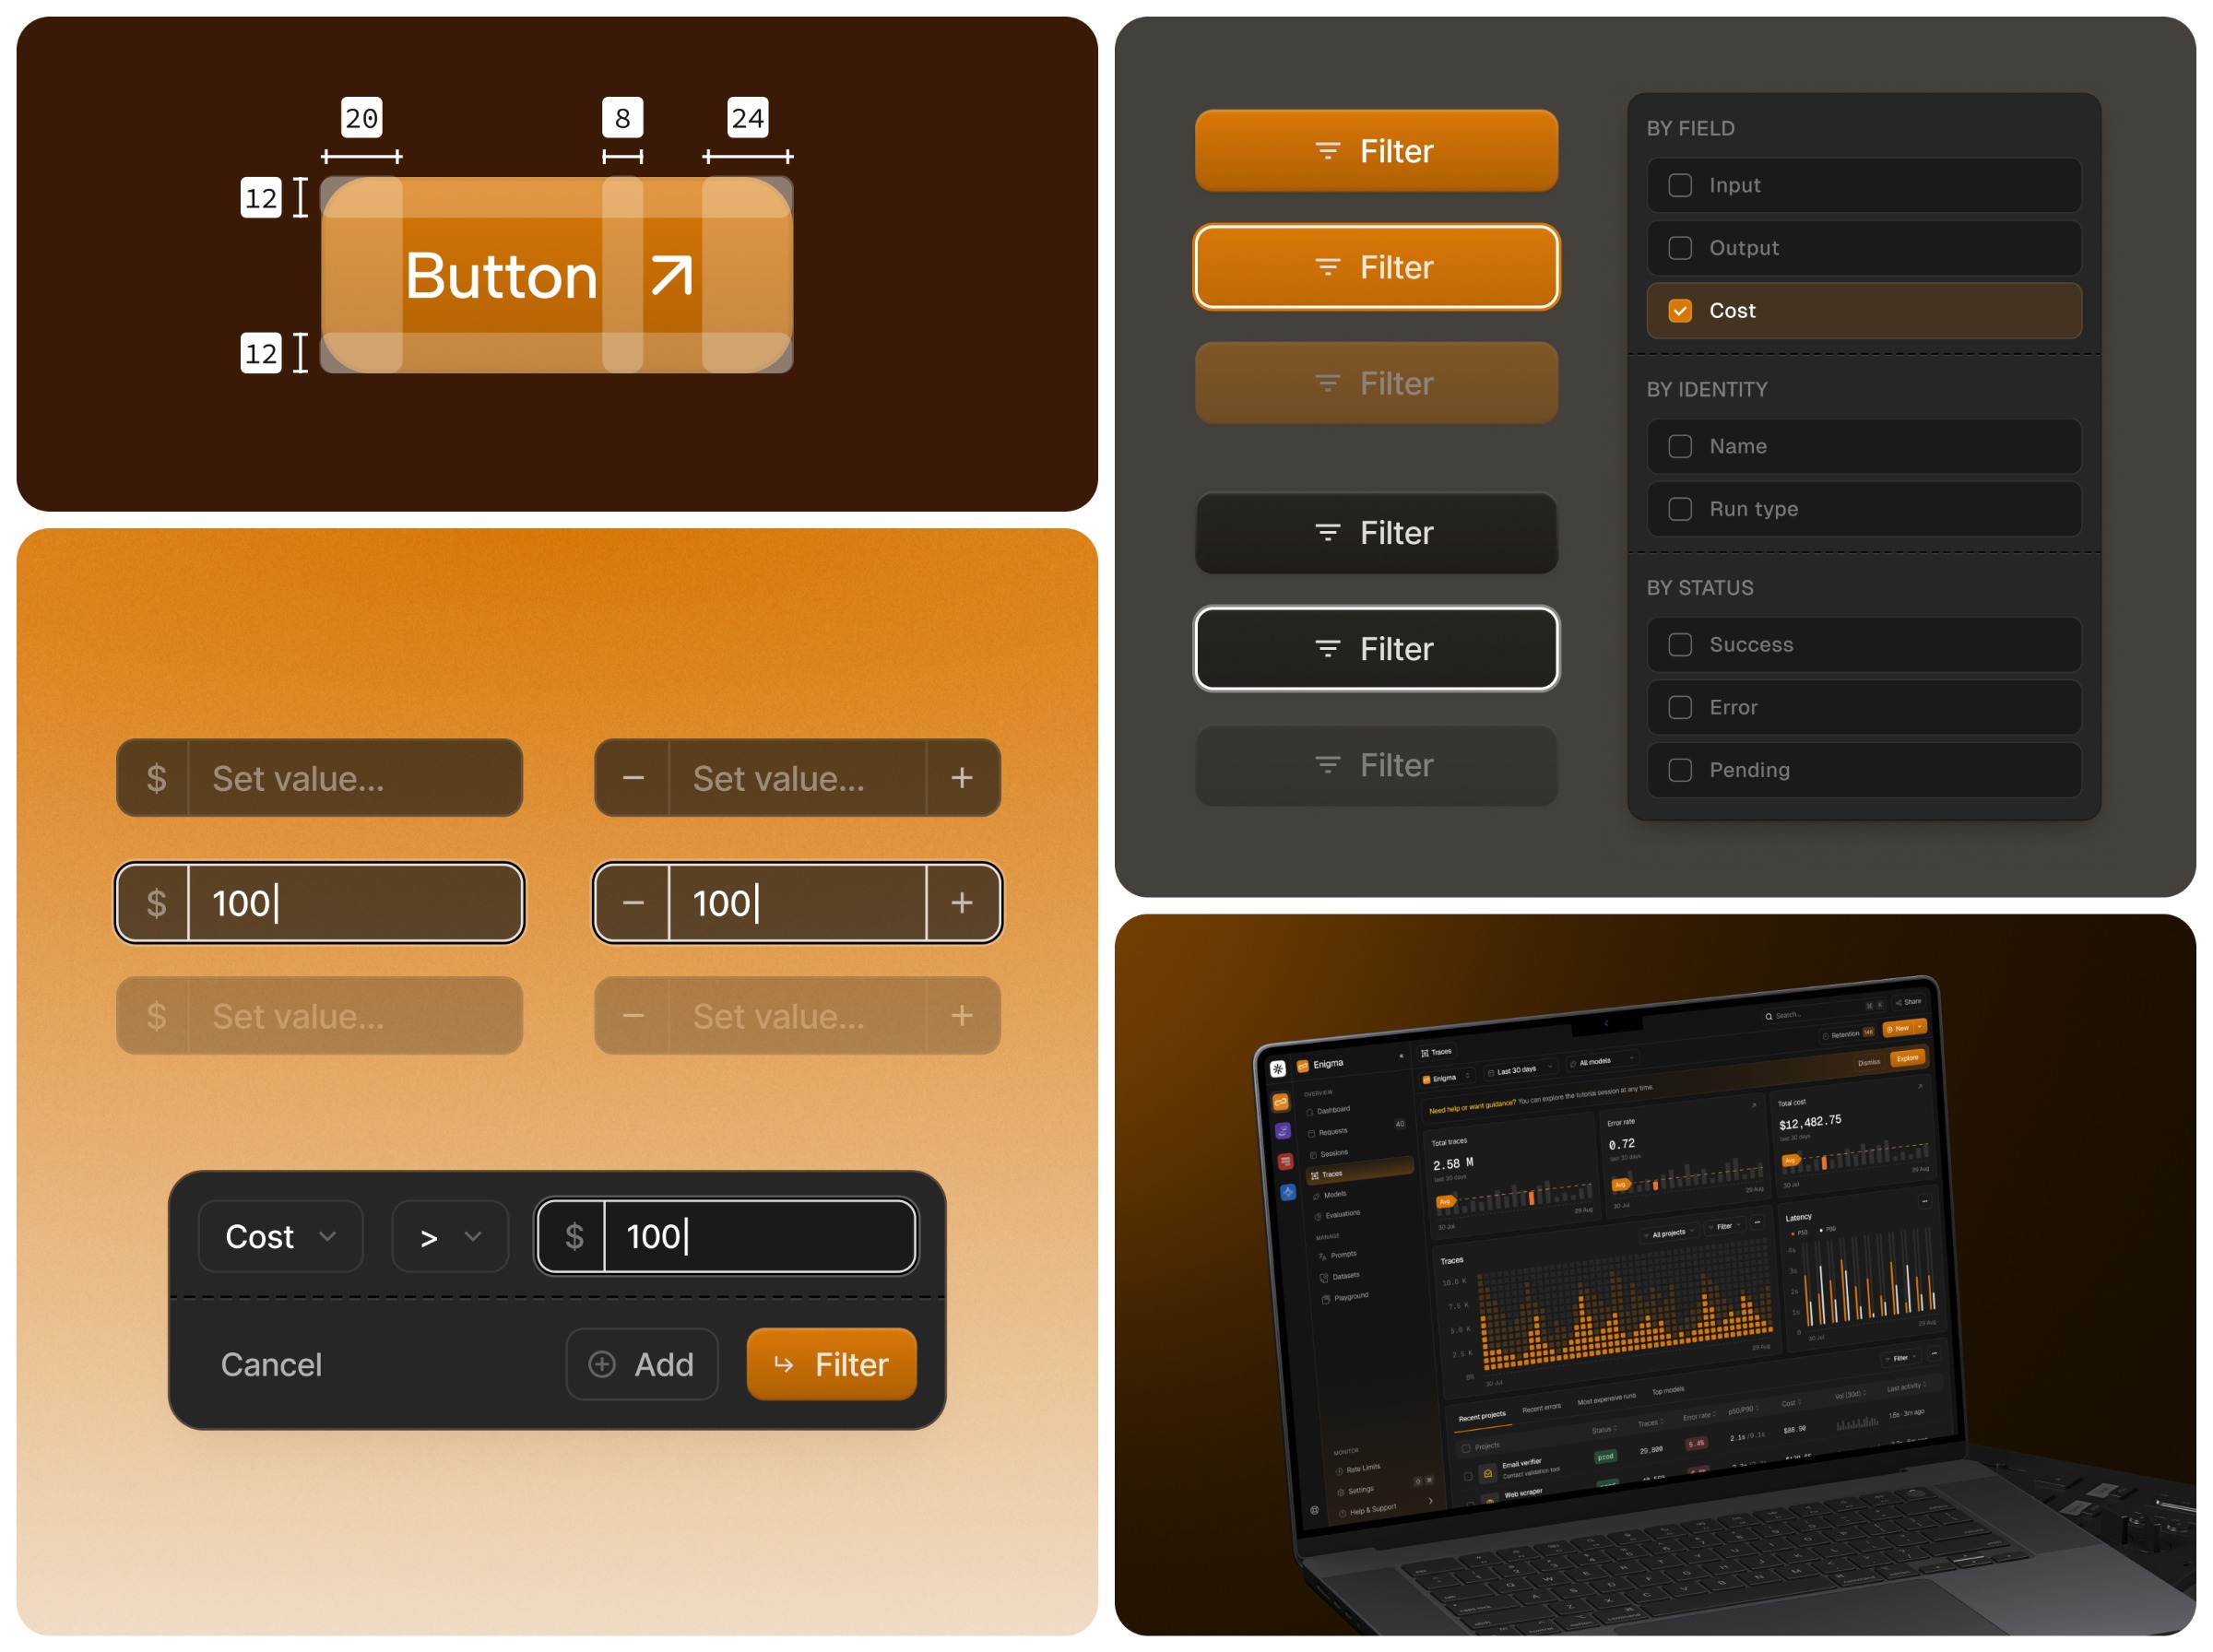
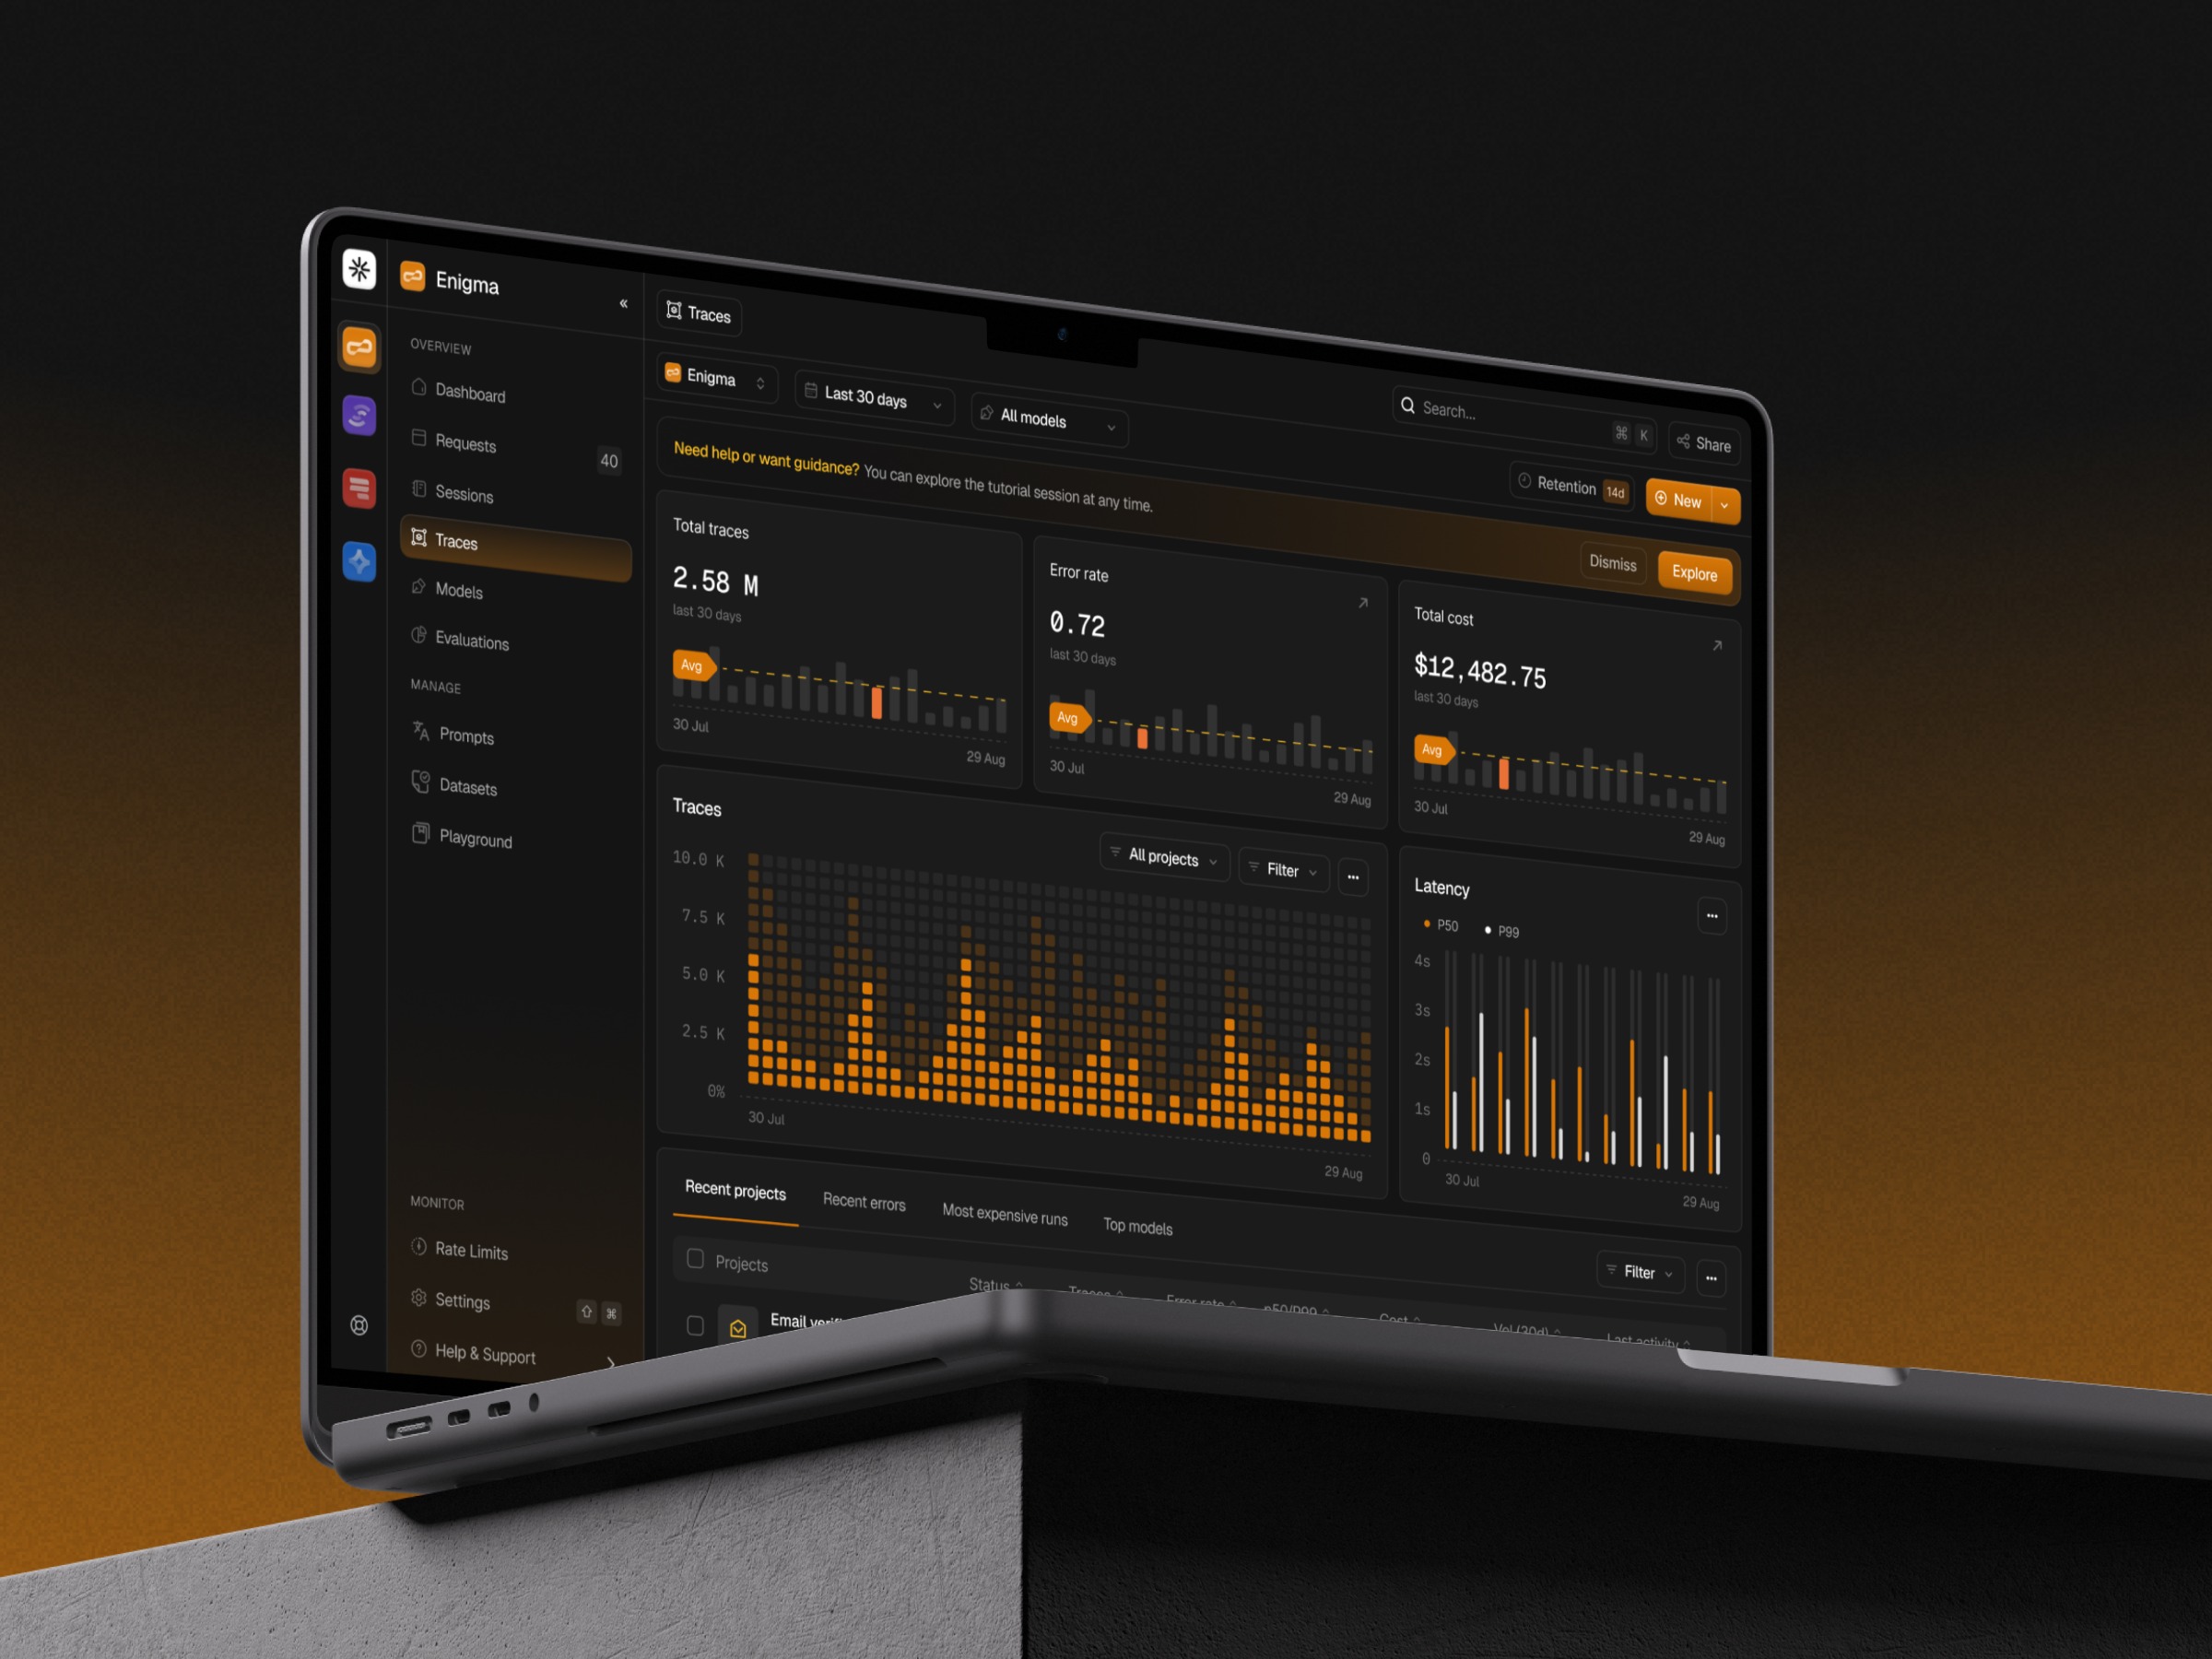
Enigma’s Traces dashboard brings agent activity, errors, latency, and cost into one monitoring view. Summary cards and charts show patterns across projects, with individual run histories available for a closer look. Tabbed tables organize recent projects, errors, expensive runs, and top models within the same space. Filters group options by field, identity, and status, while colored badges distinguish environments and highlight error severity. The visual direction pairs charcoal surfaces with orange accents, subtle borders, and monospaced metrics. The motion walkthrough moves from the traces overview into a project’s run list, then shows how a cost filter is configured.