

Renewable Energy Management
Project description
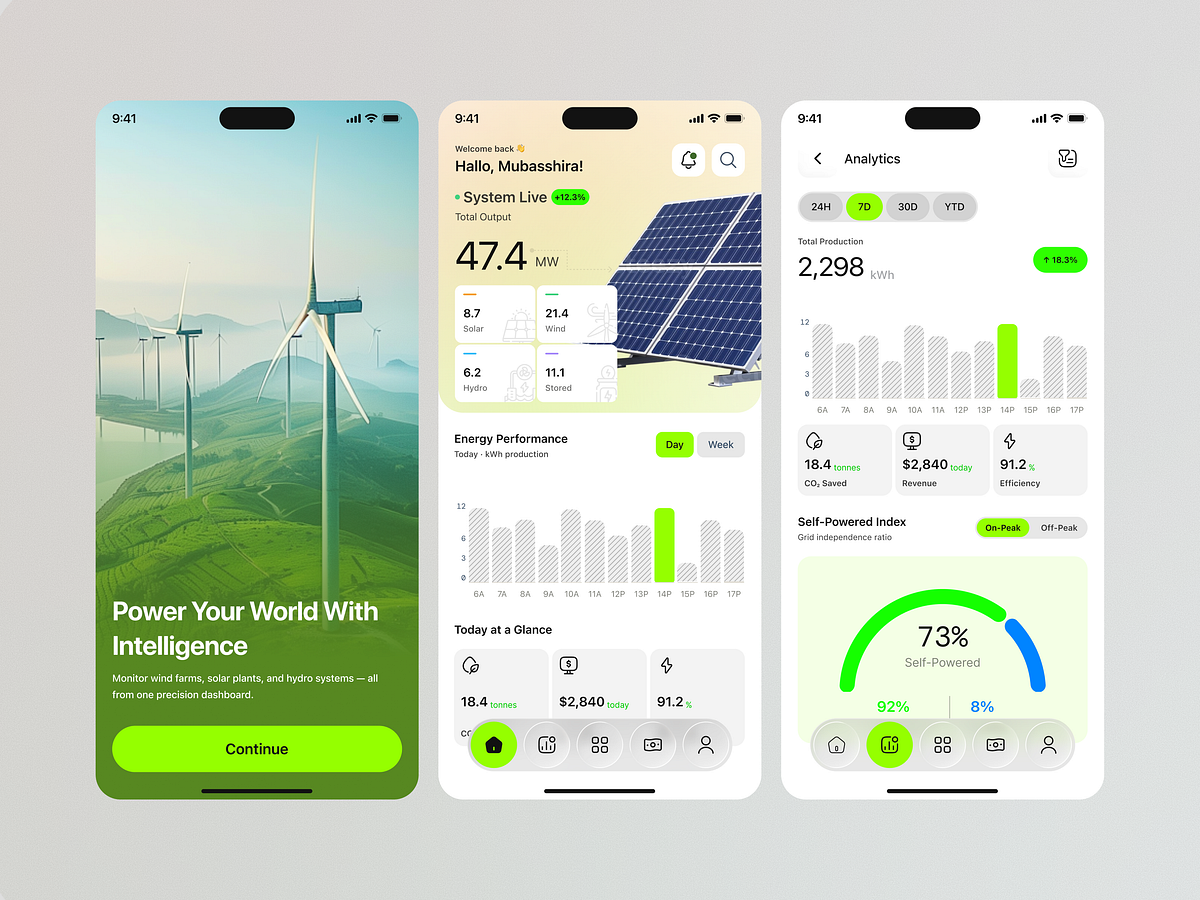
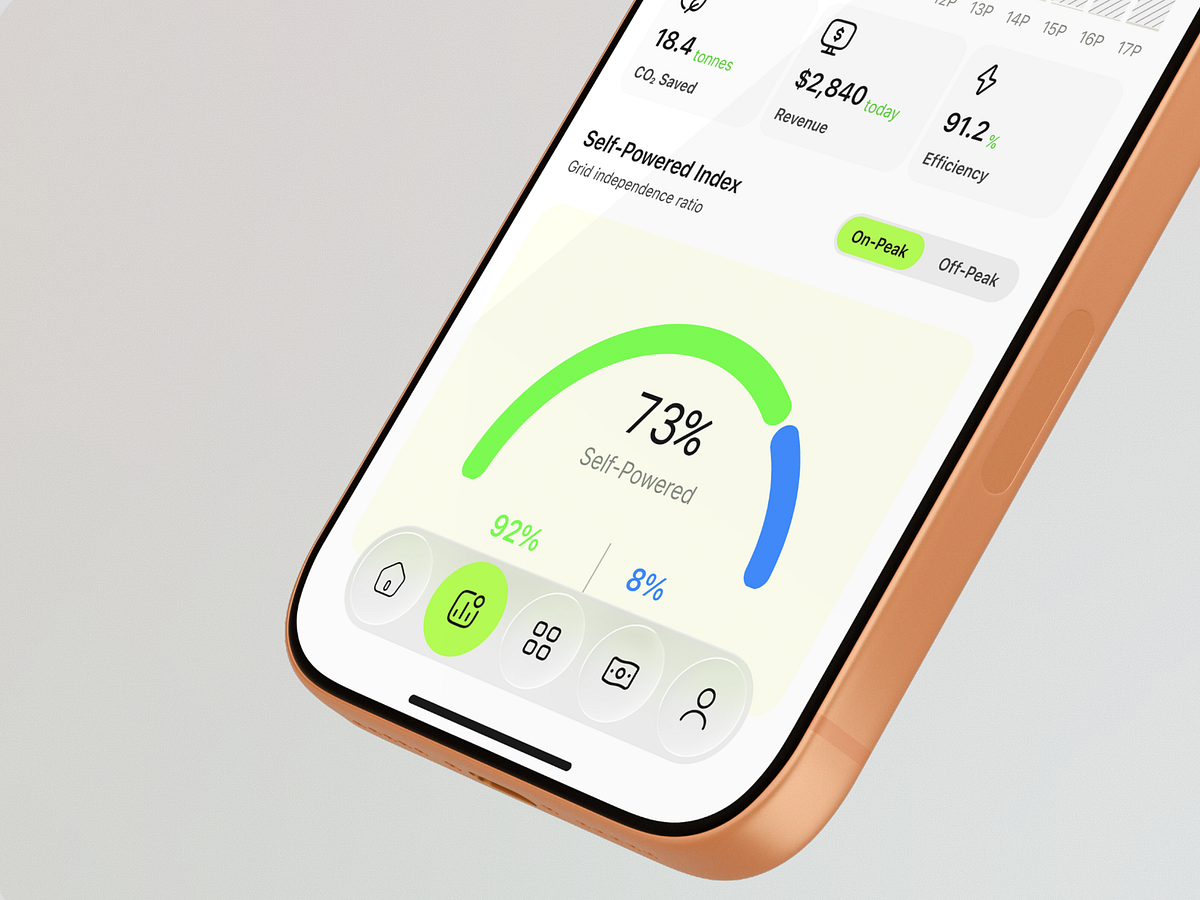
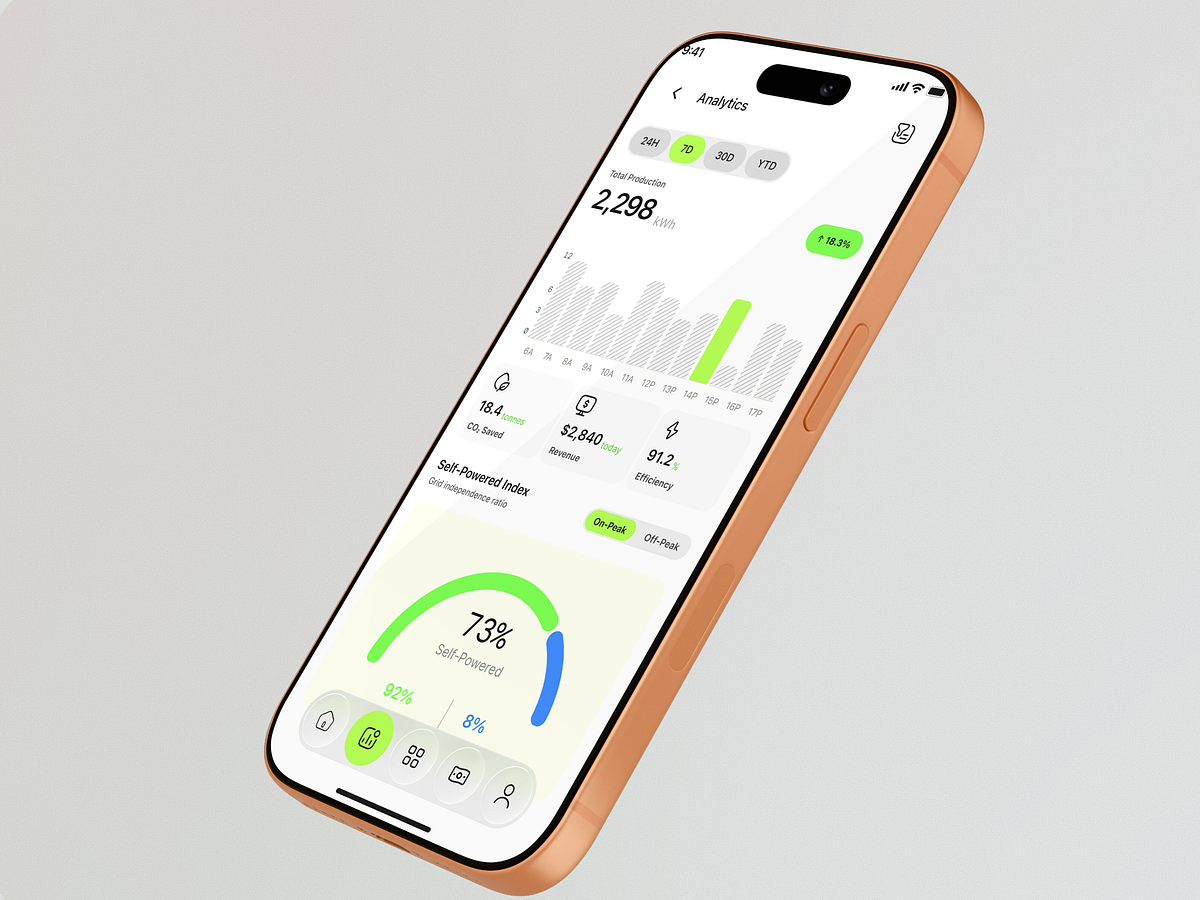
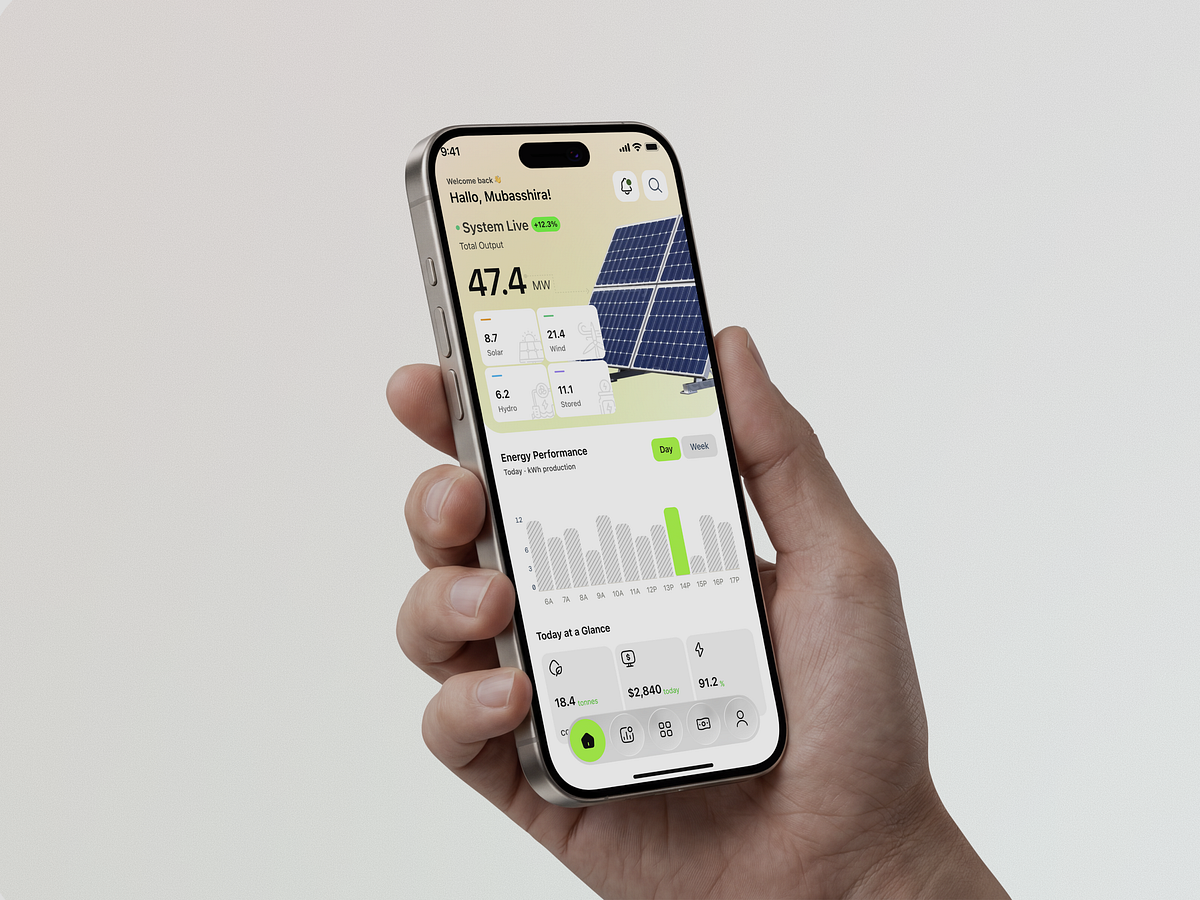
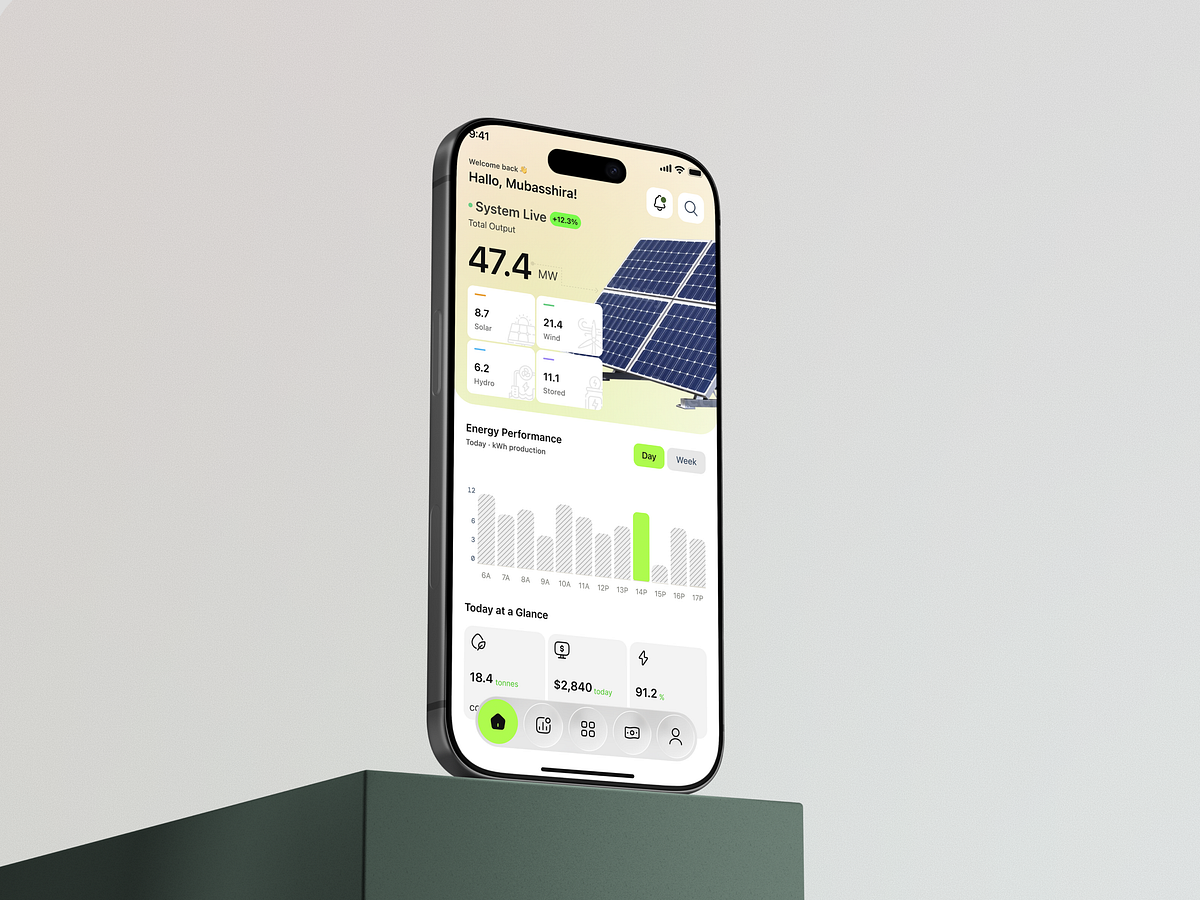
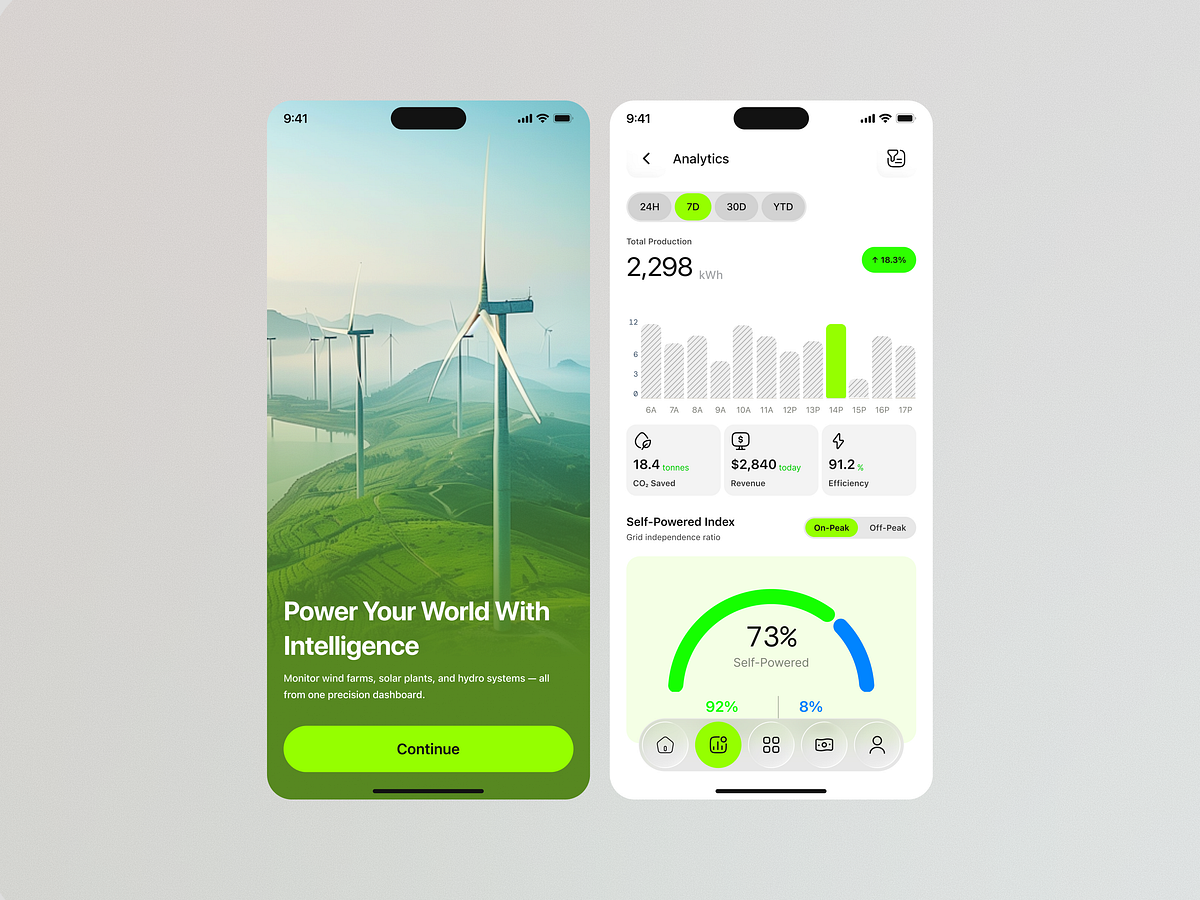
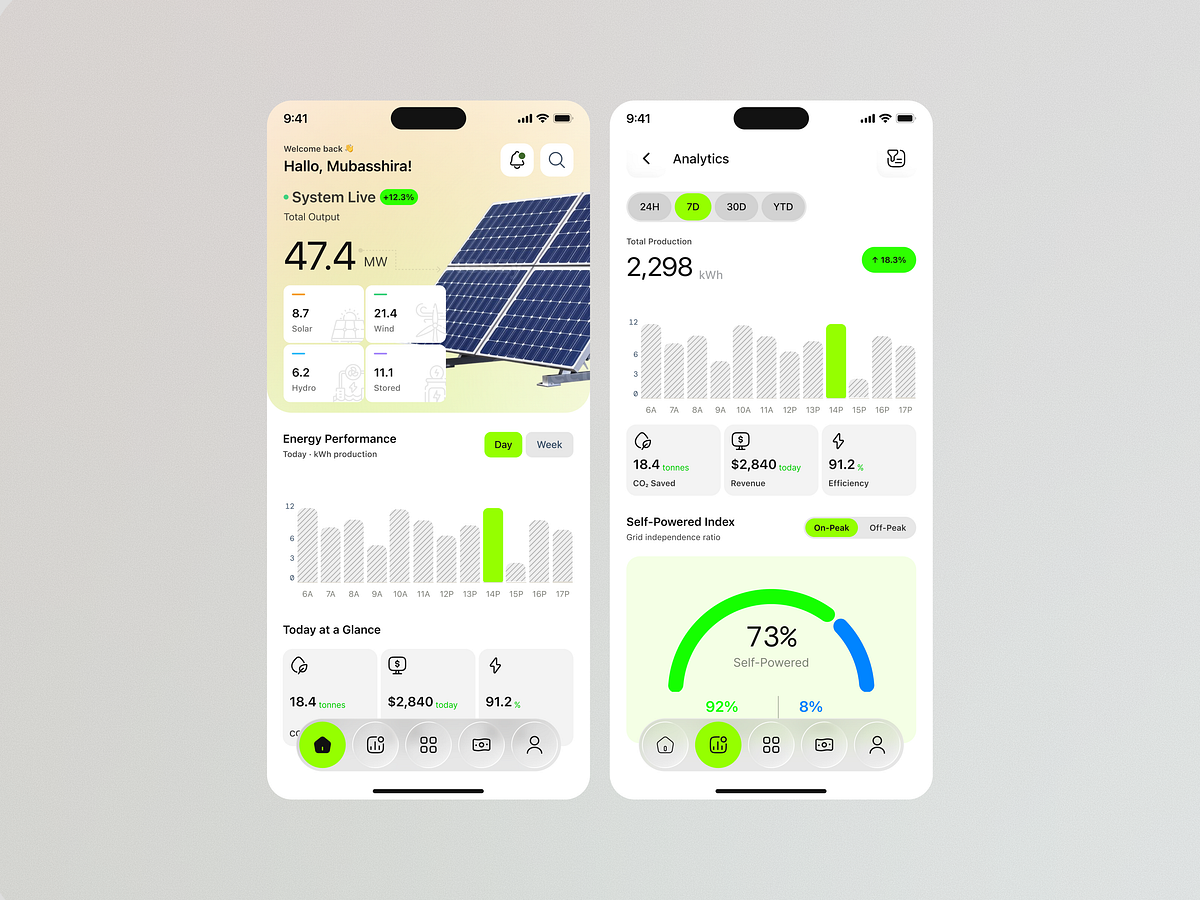
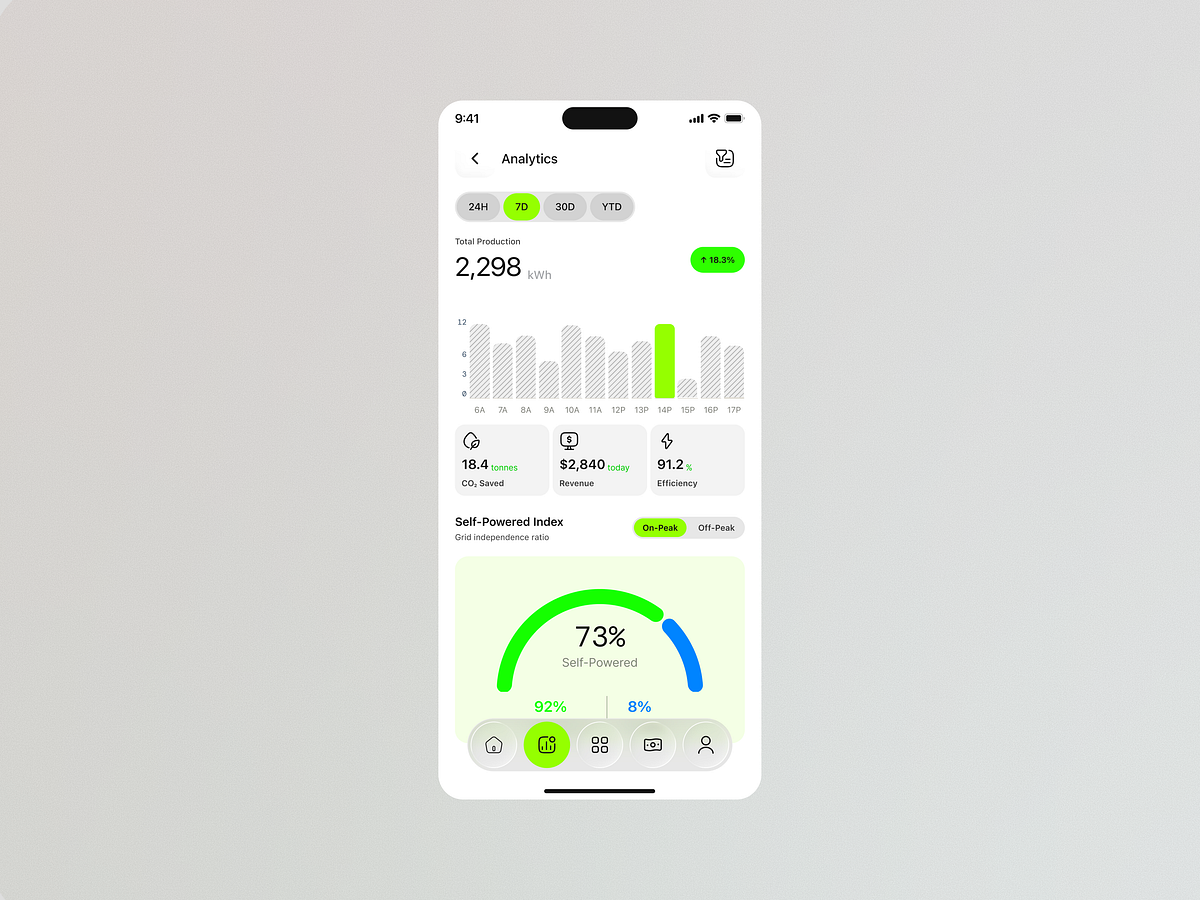
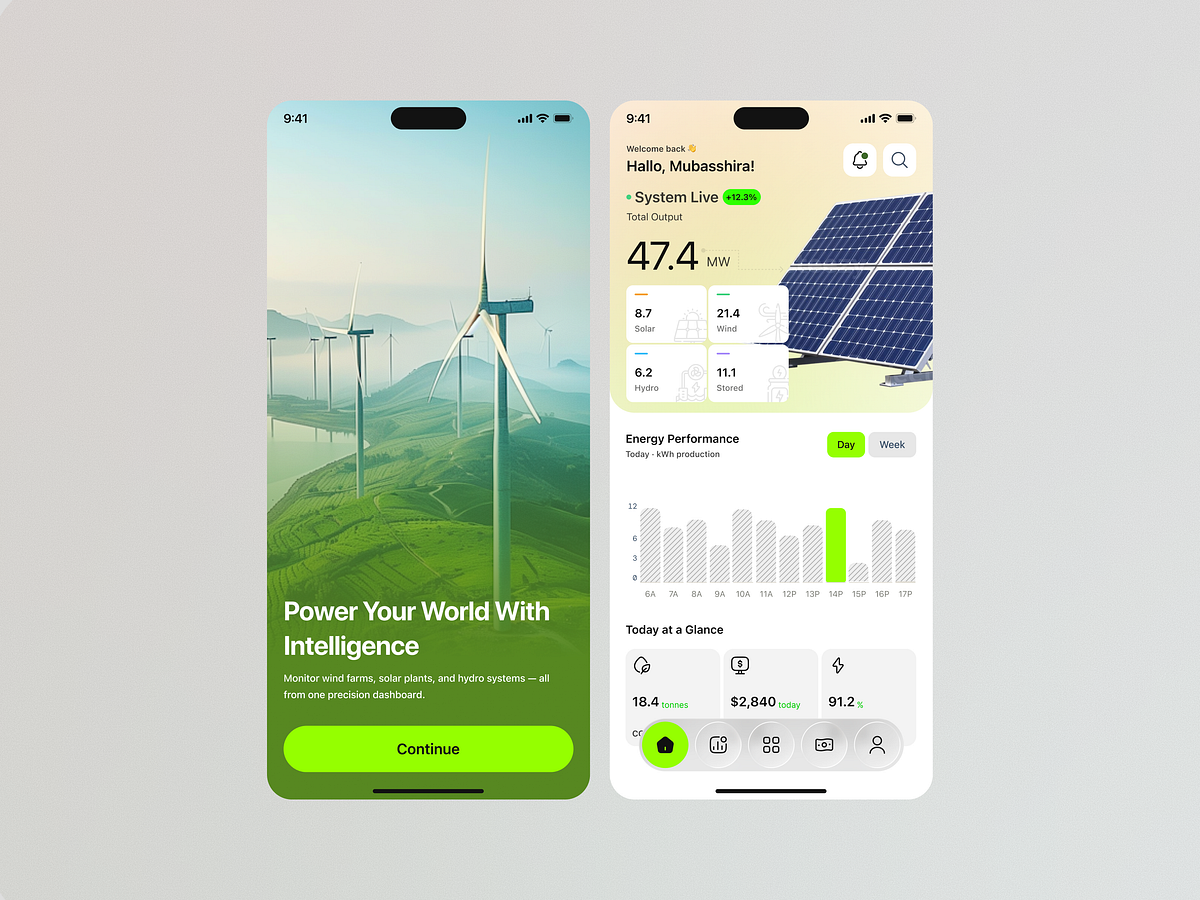
Problem Managing renewable energy systems involves monitoring multiple sources—solar, wind, hydro, and energy storage—while keeping track of production, efficiency, revenue, and environmental impact. Presenting all of this data clearly can be challenging. Challenge The challenge was to design a mobile experience that makes complex energy data easy to understand at a glance, while giving users a clear view of real-time performance and longer-term production trends. Solution- I designed a visual-first renewable energy dashboard that brings multiple energy sources into one unified experience. The interface prioritizes total output, source-level performance, energy trends, and key sustainability metrics, allowing users to quickly understand how the system is performing. The visual language combines clean data visualization with a nature-inspired aesthetic, reflecting the product's focus on clean energy, efficiency, and sustainability. Key UX Decisions Unified solar, wind, hydro, and storage data in one dashboard Prioritized total energy output for quick visibility Used charts to make production patterns easier to interpret Added 24H, 7D, 30D, and YTD views for flexible analysis Highlighted key metrics such as CO₂ savings, revenue, and efficiency Introduced a Self-Powered Index to communicate energy independence visually Created clear navigation between monitoring and analytics Result The concept transforms complex renewable energy data into a clear, engaging, and actionable mobile experience, helping users monitor production, understand performance trends, and make more informed energy-management decisions.
Support this project
Be the first to upvote