
Tate — Annual Report 2020–2021

Project description
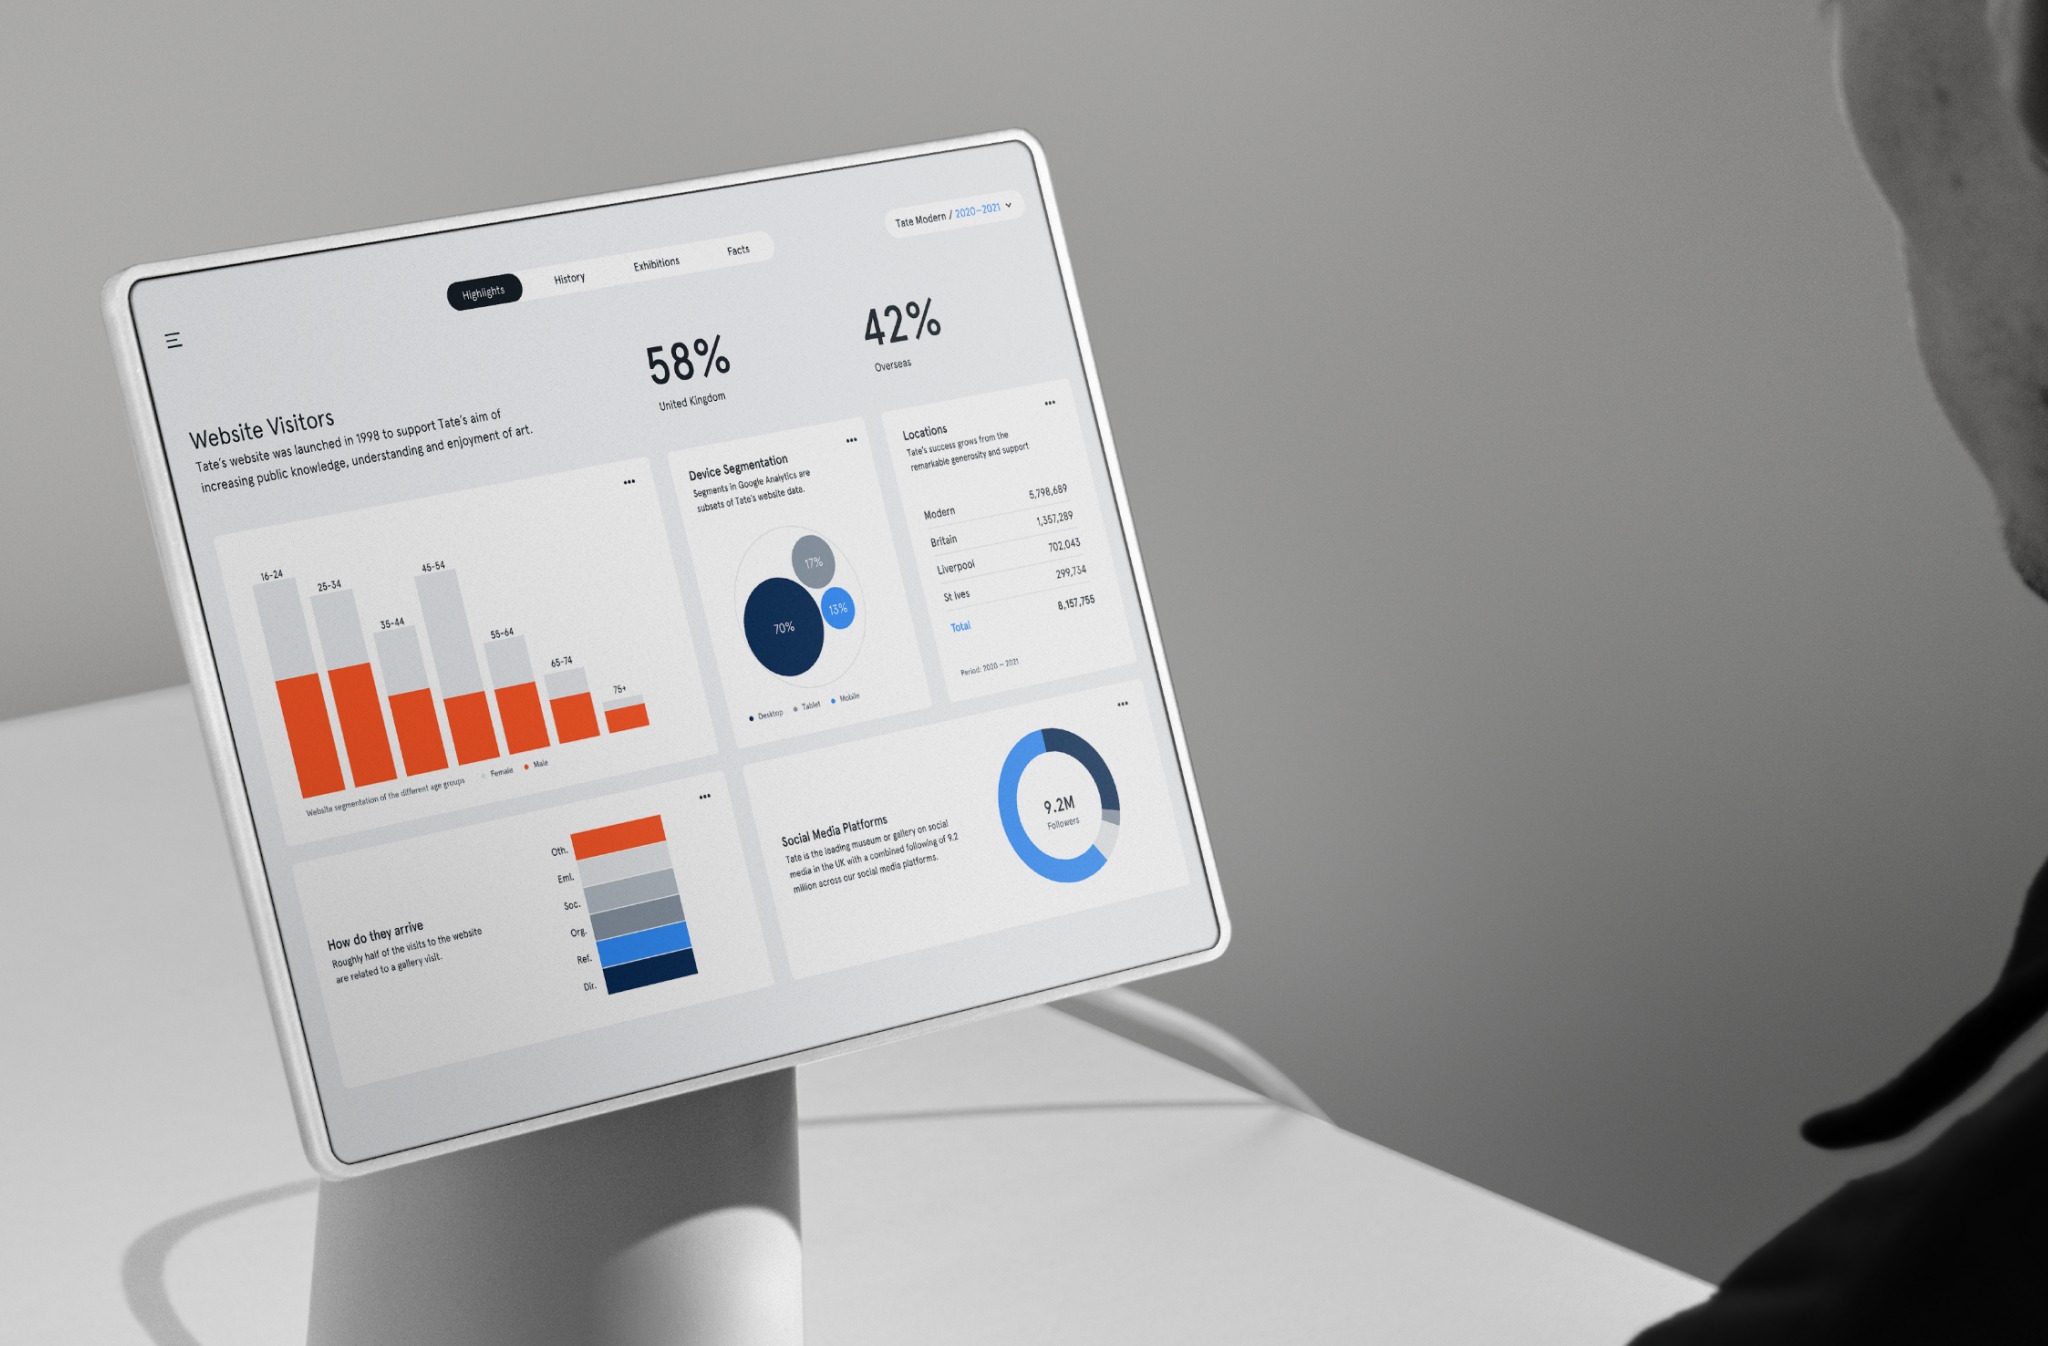
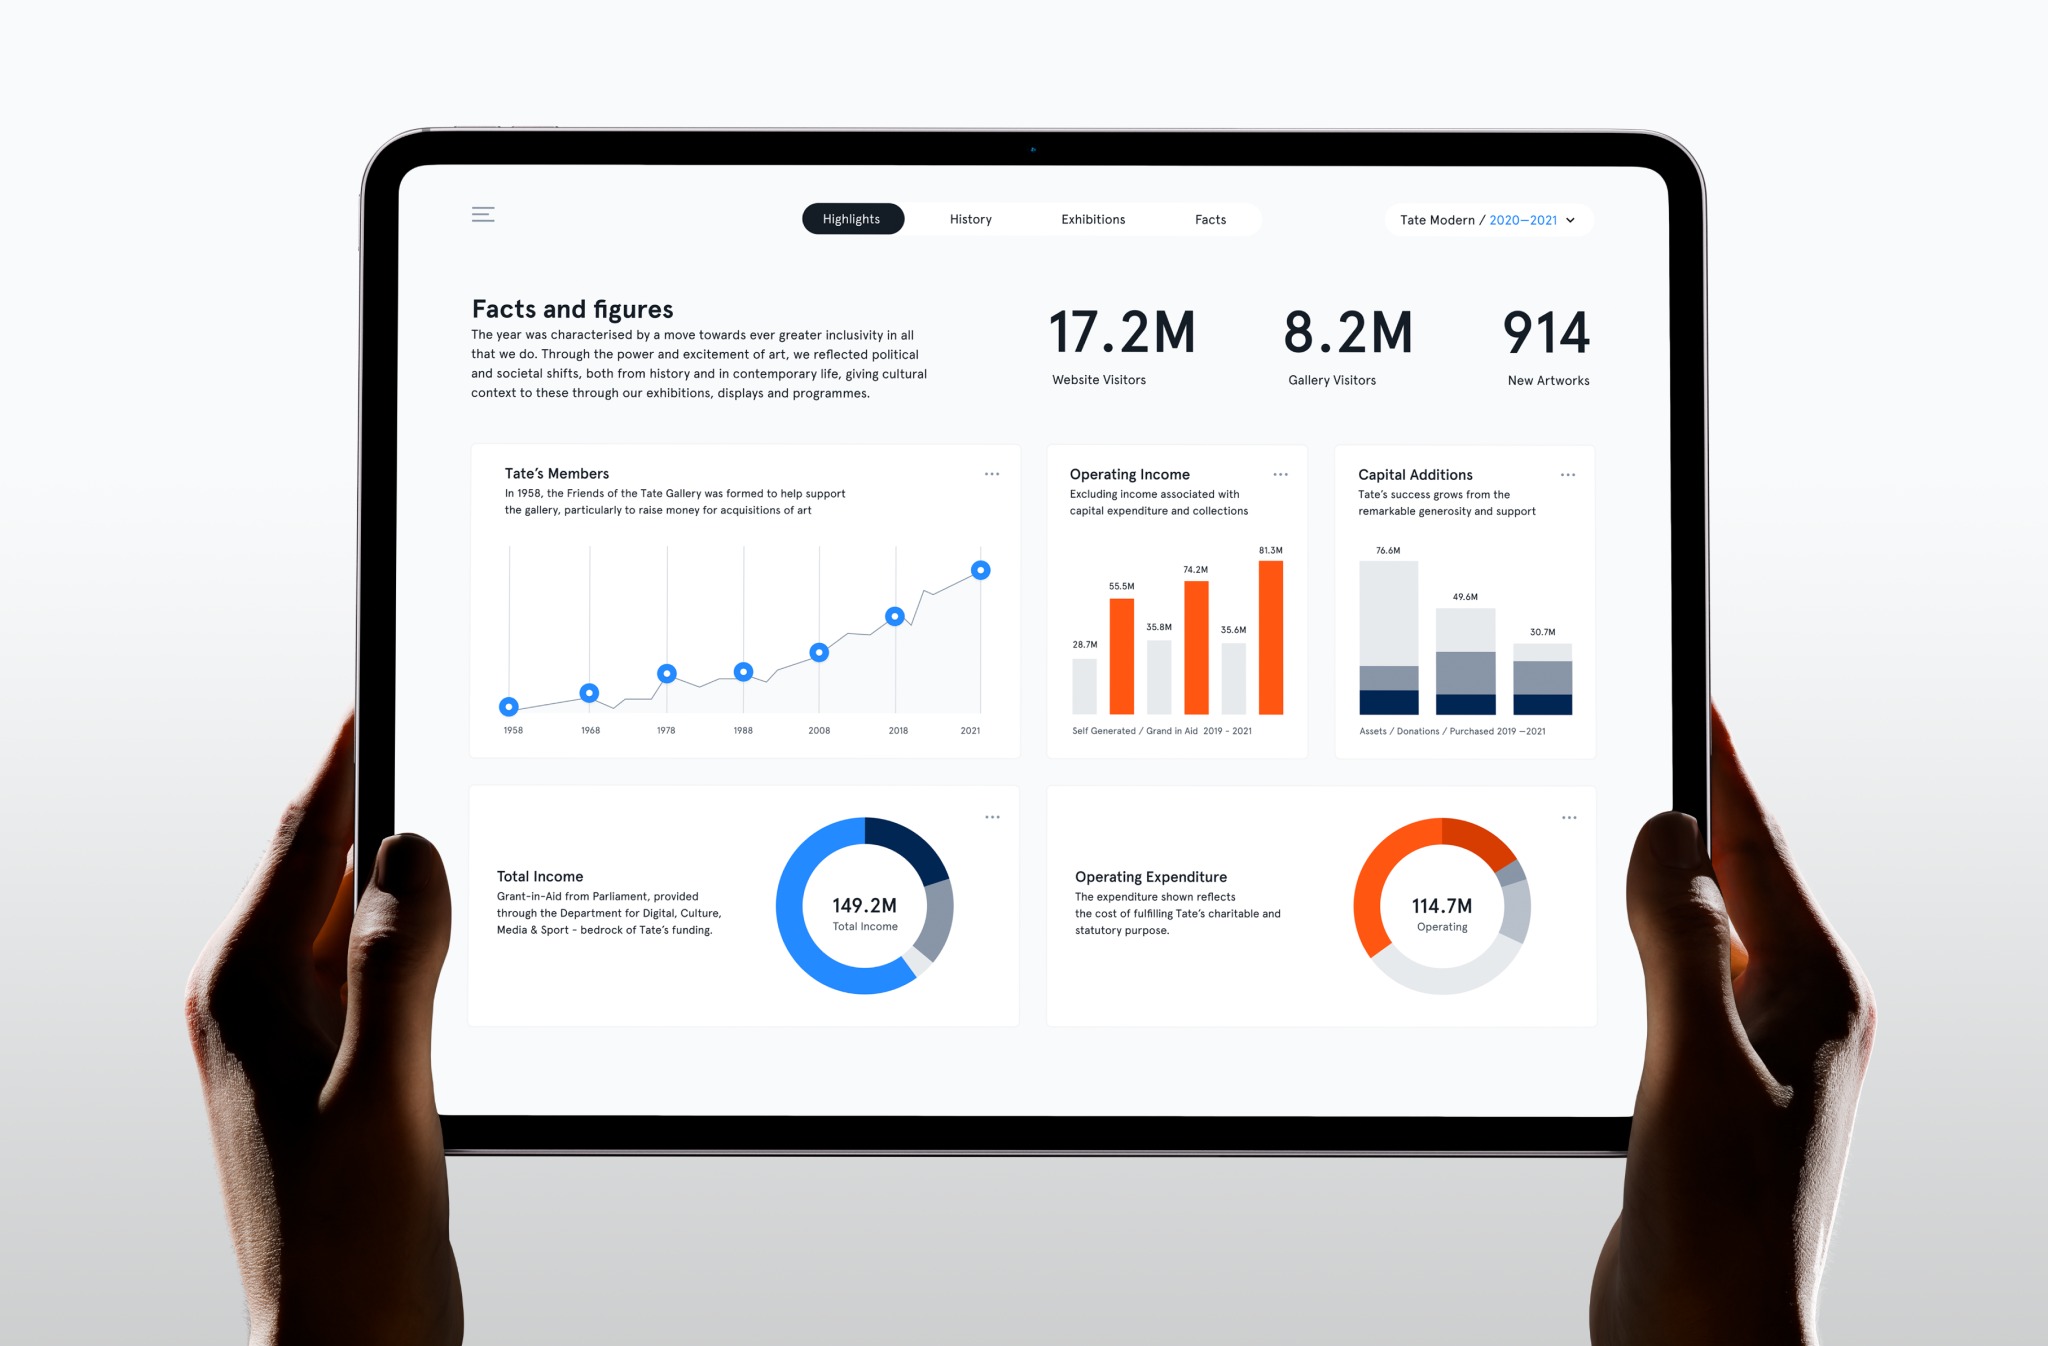
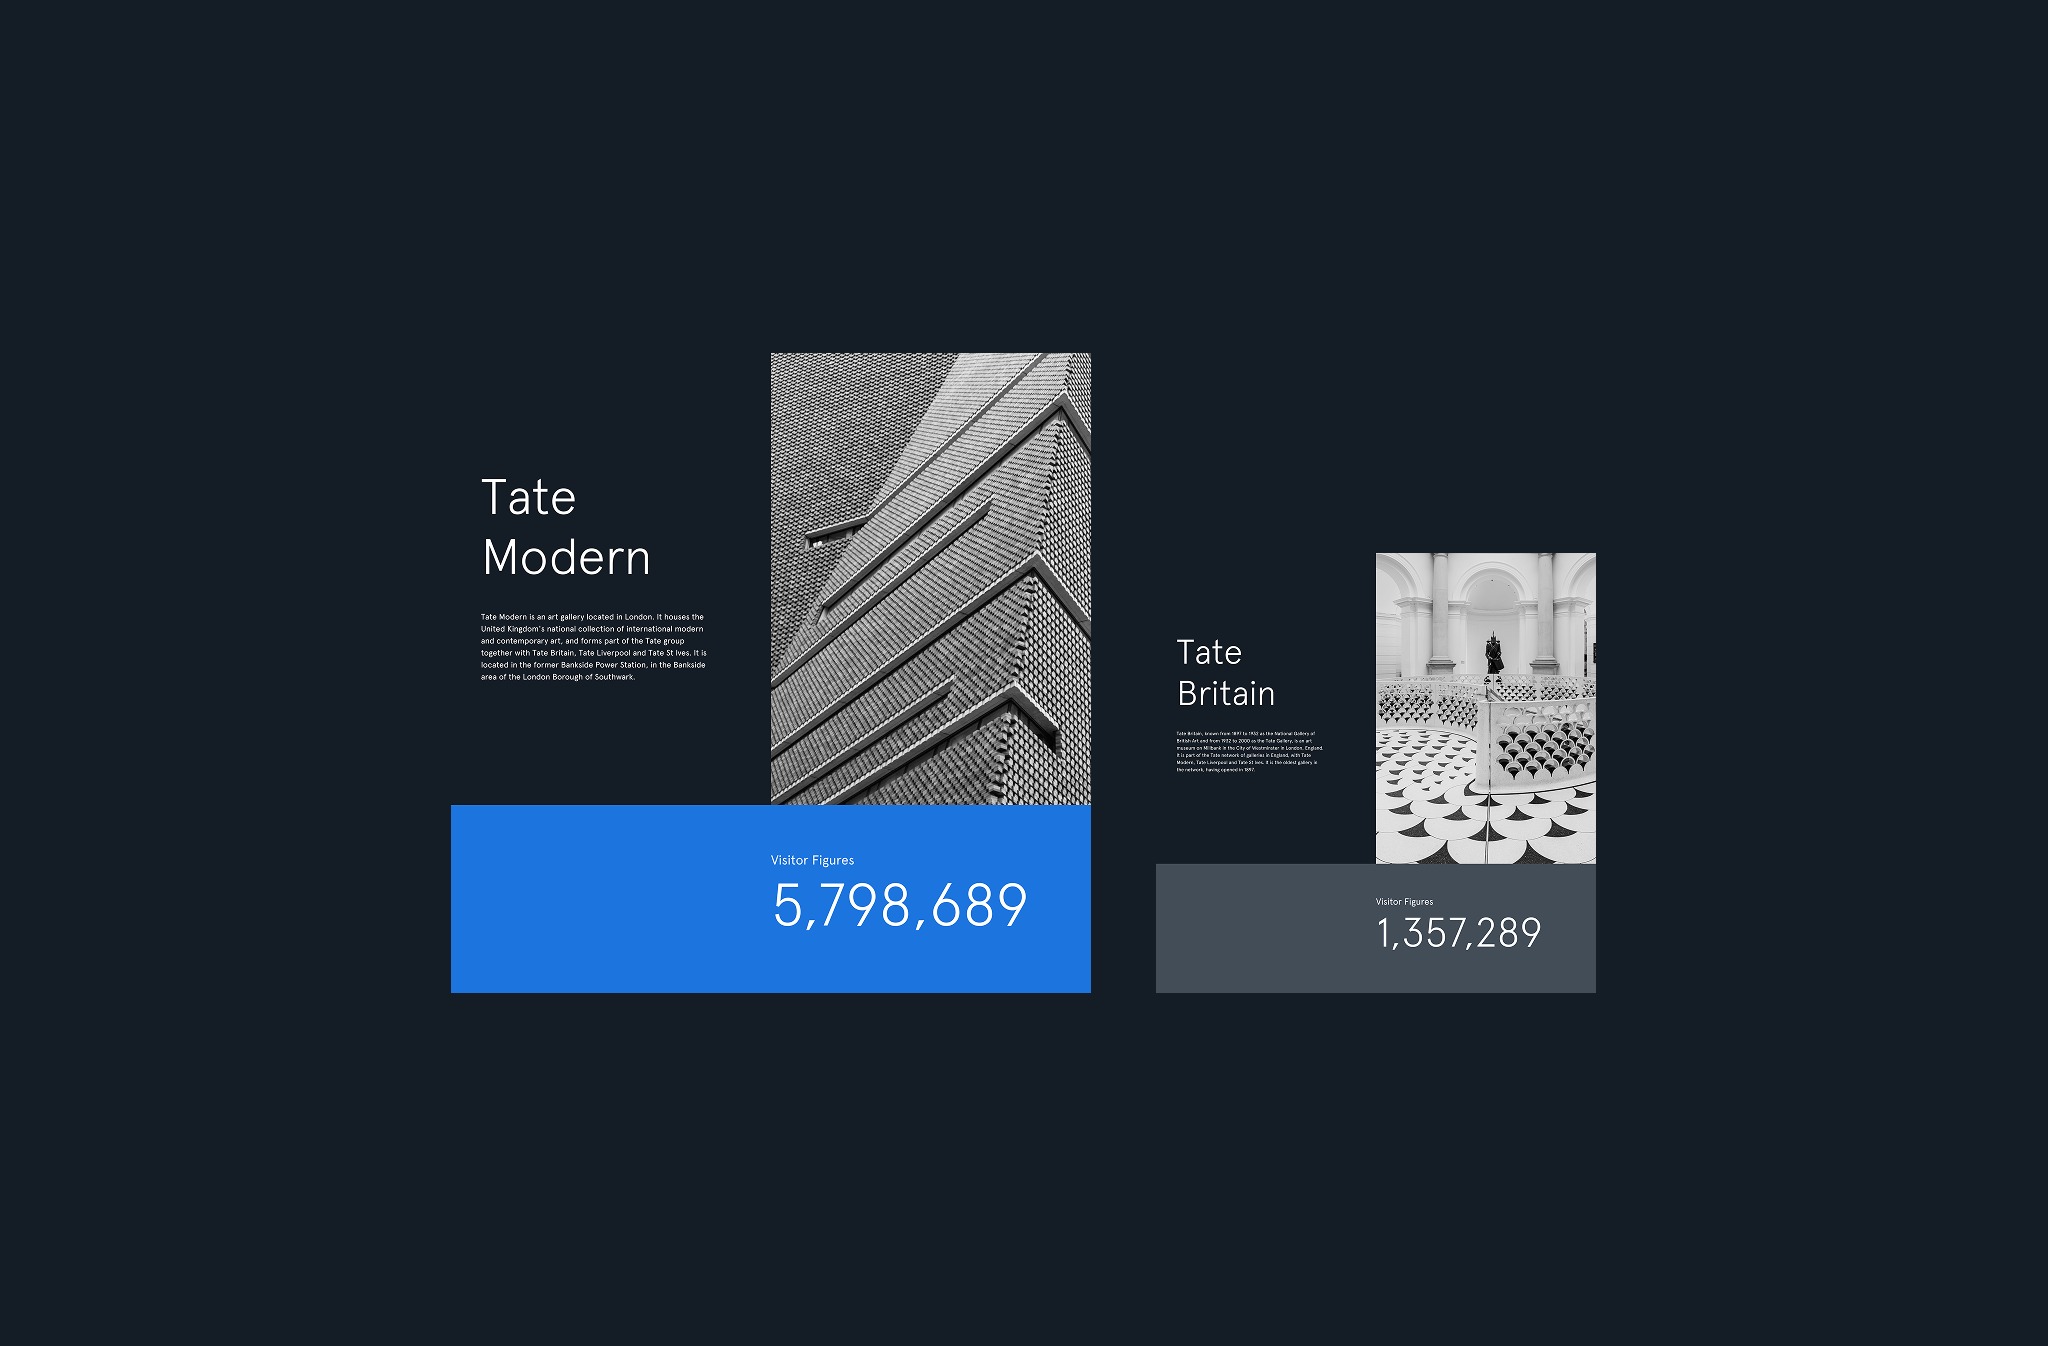
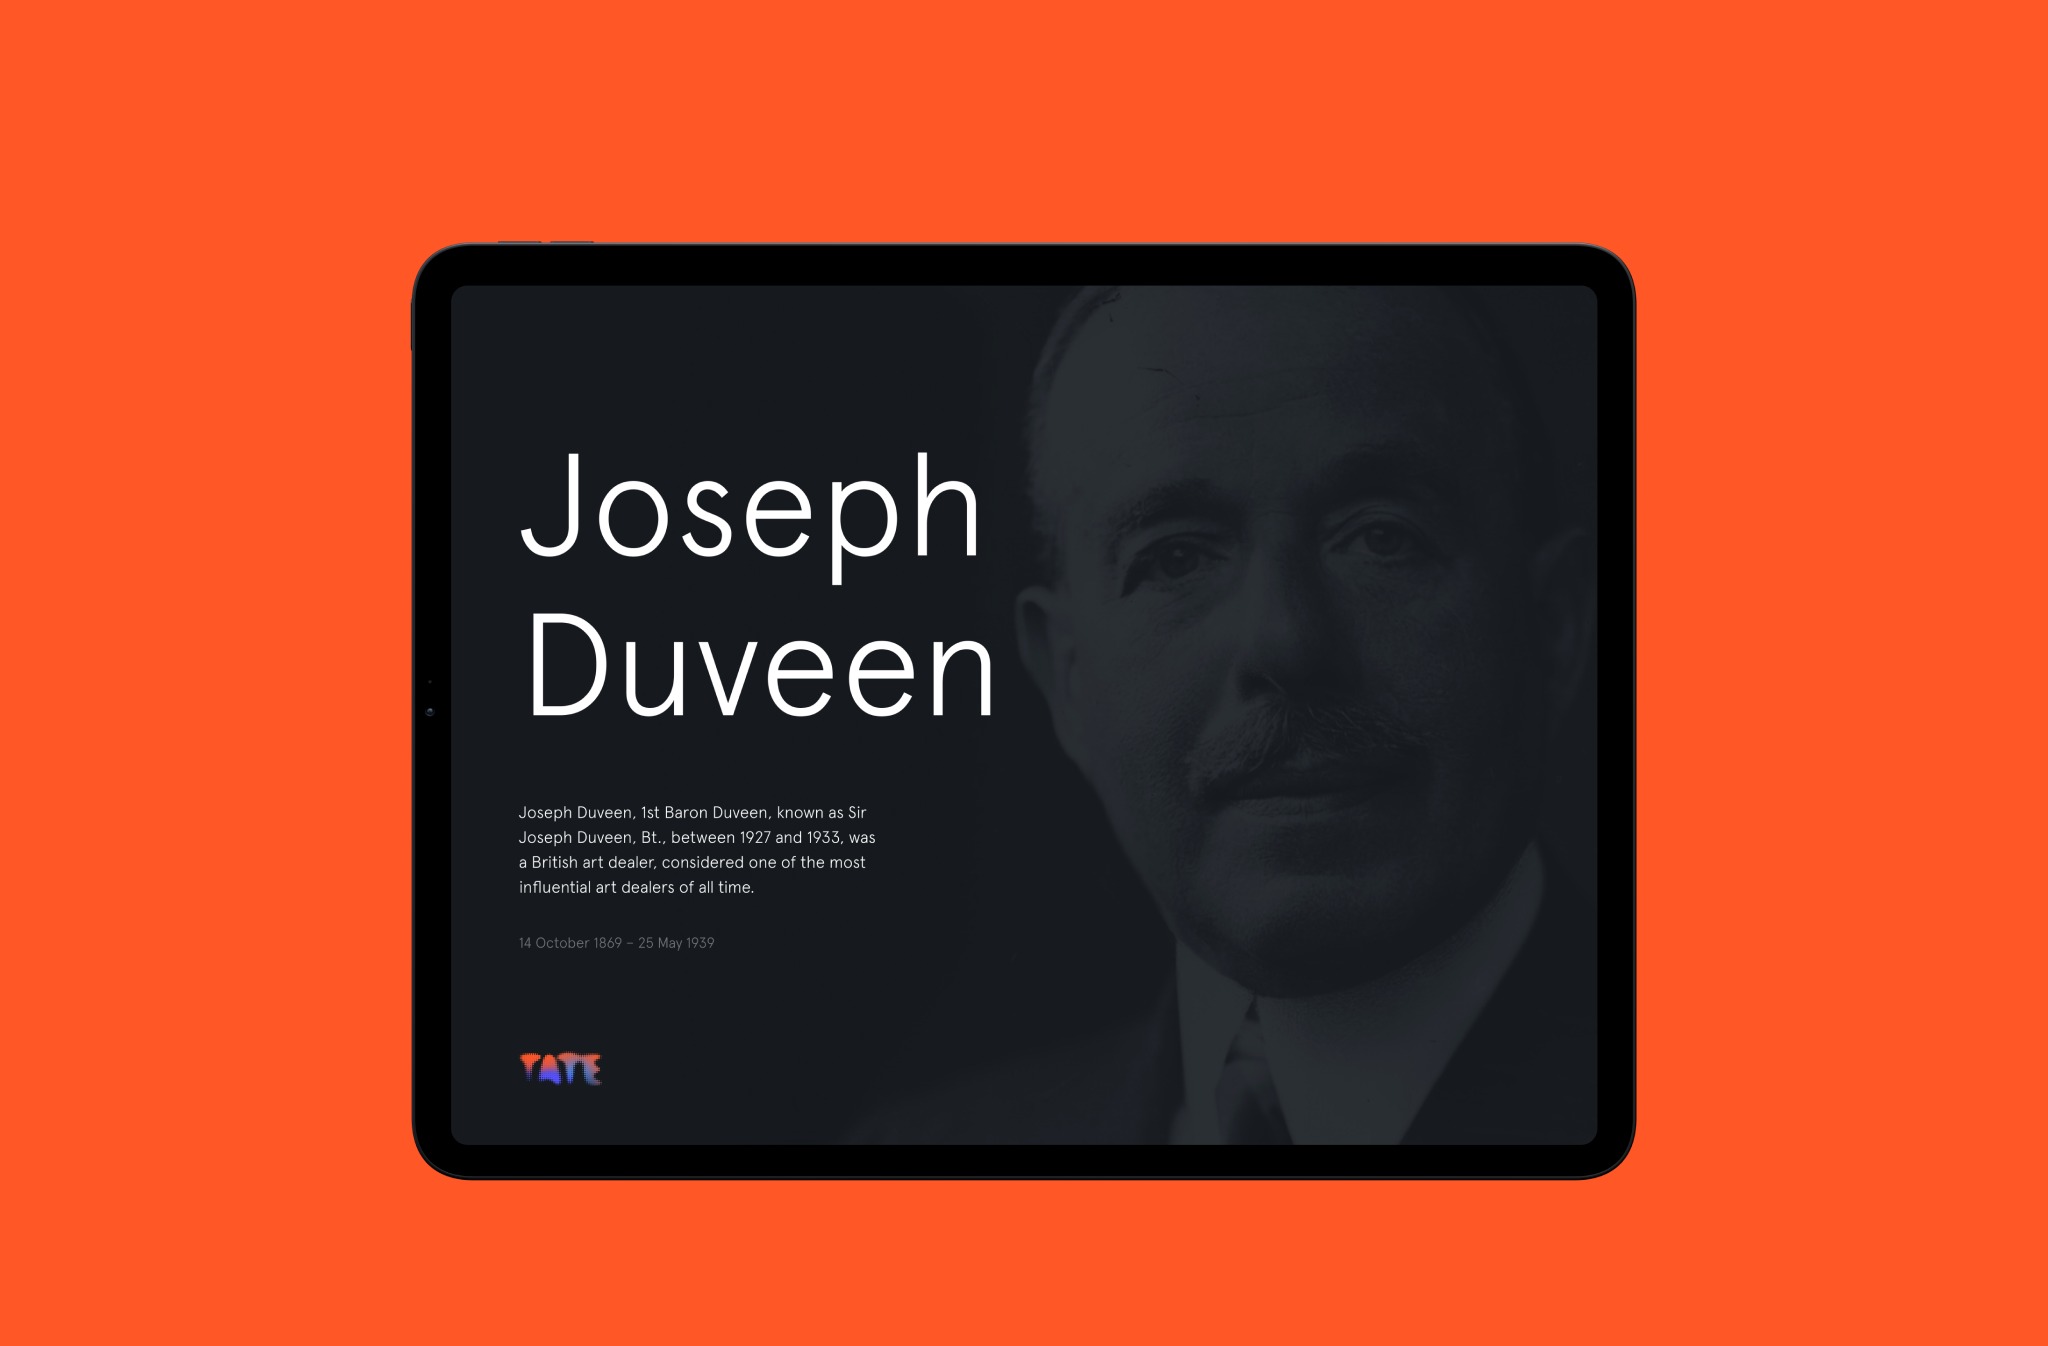
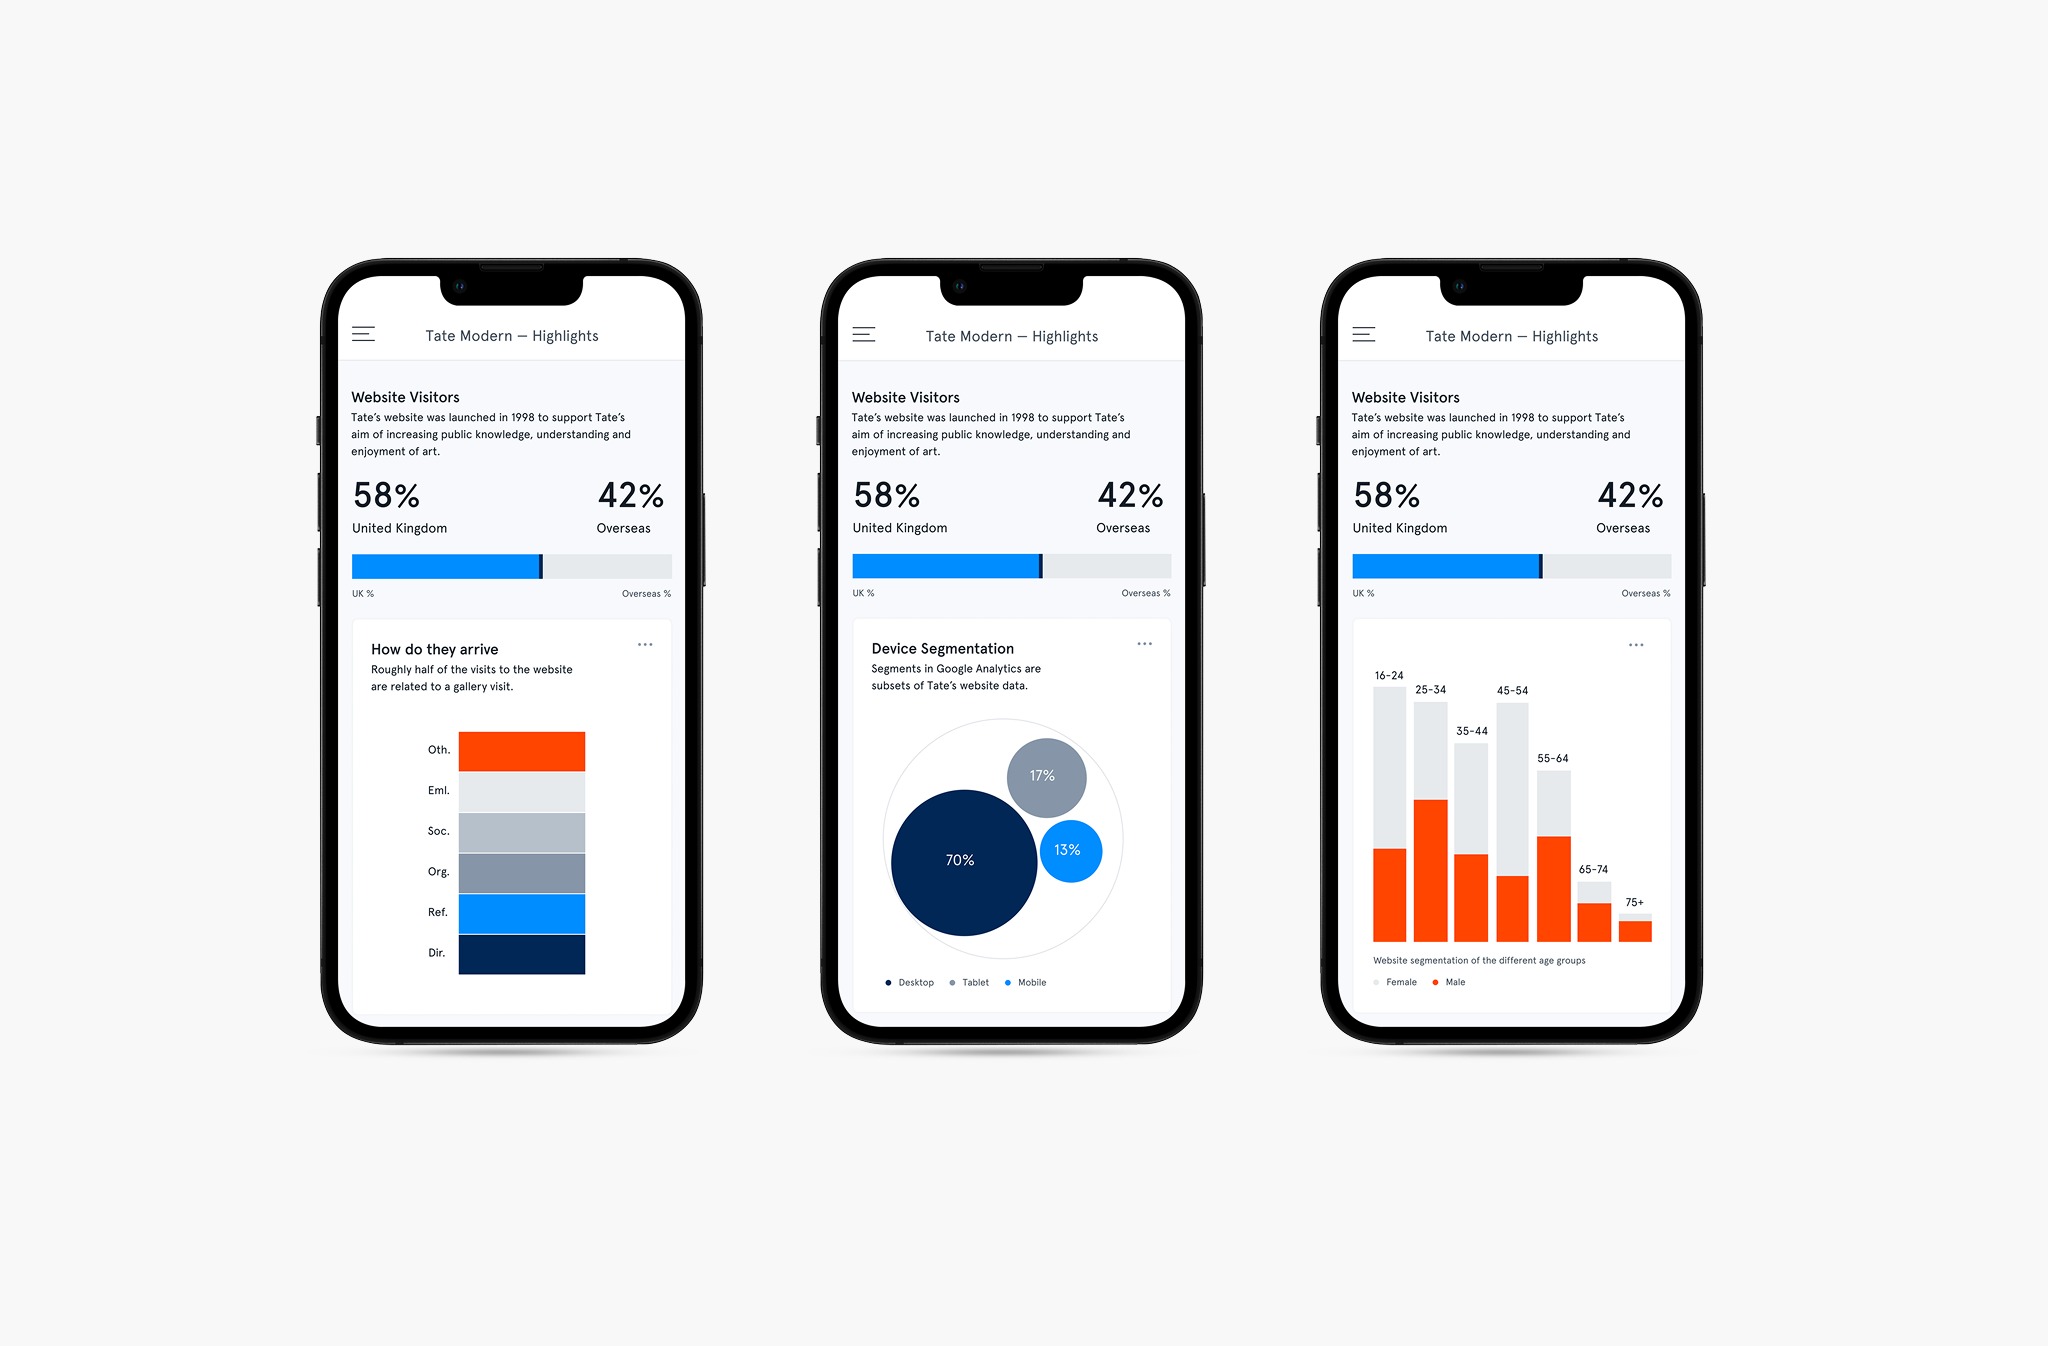
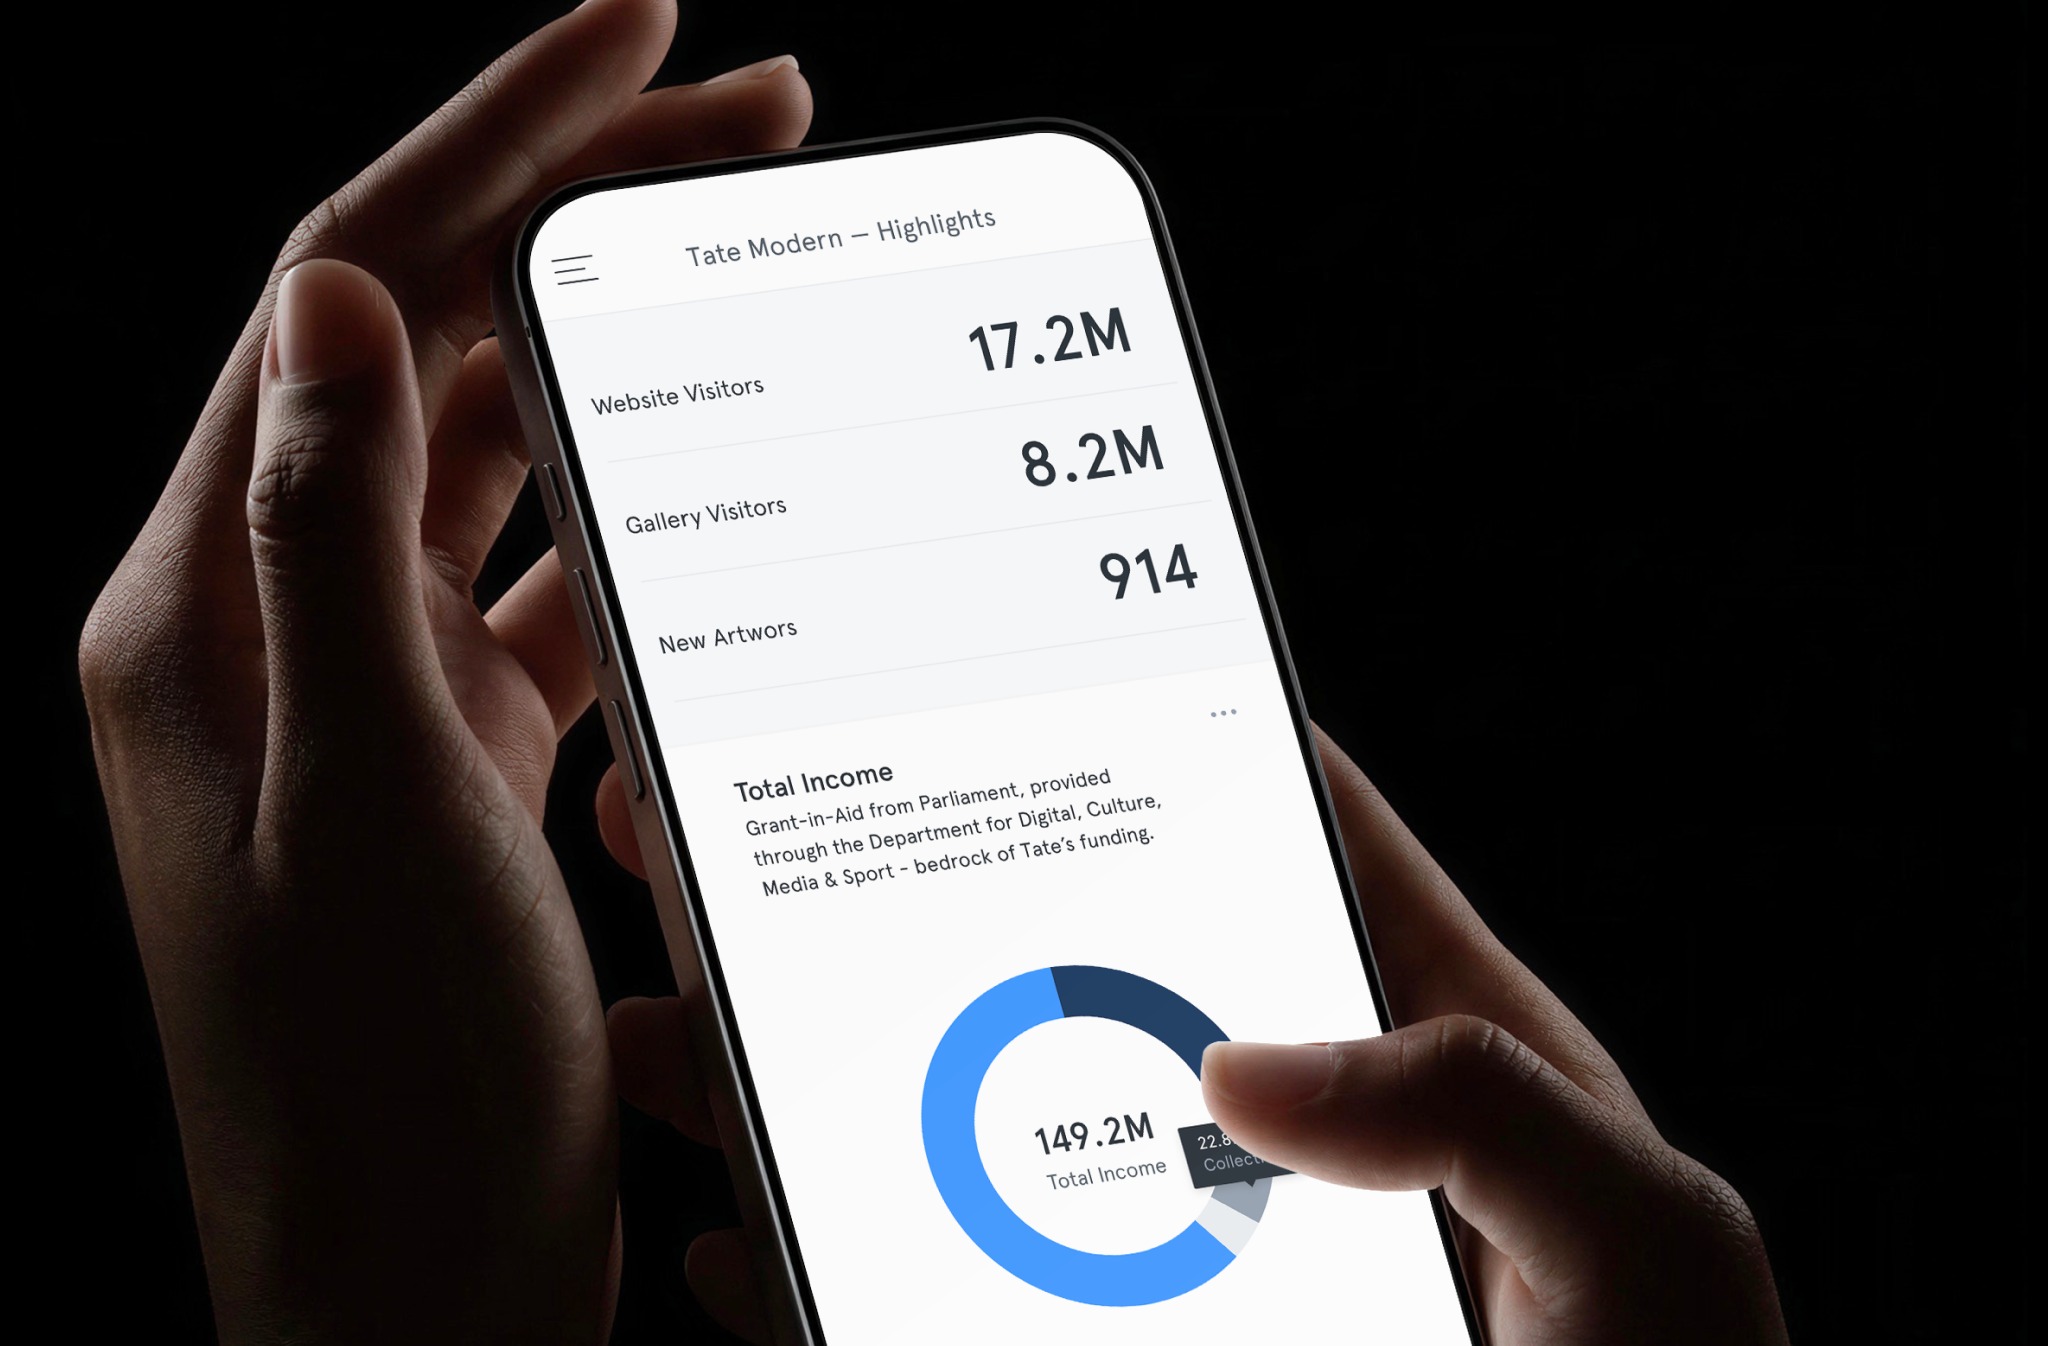
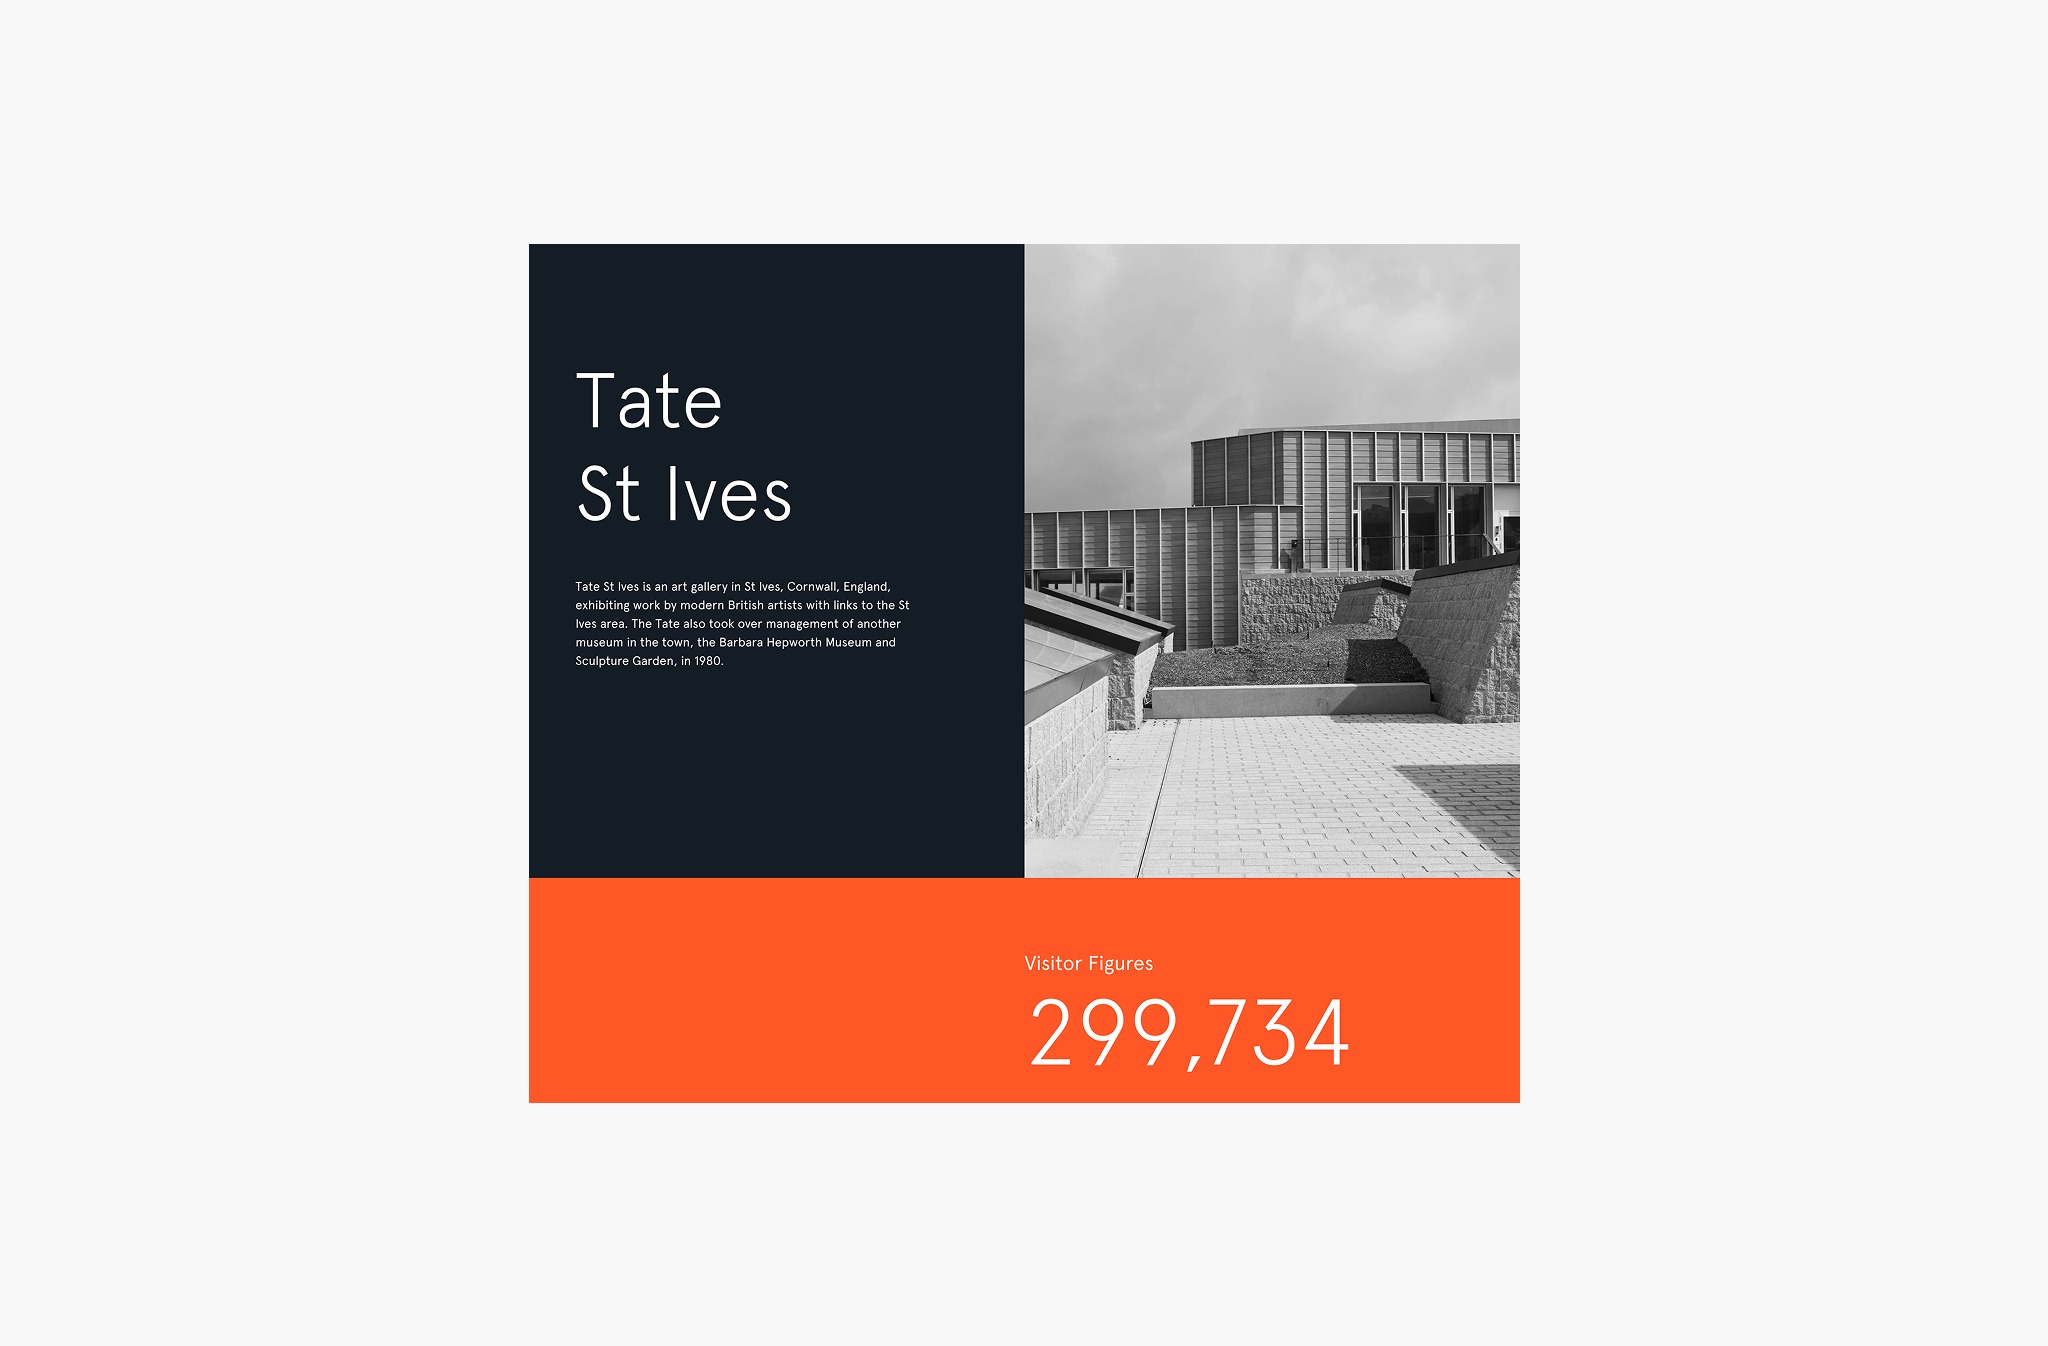
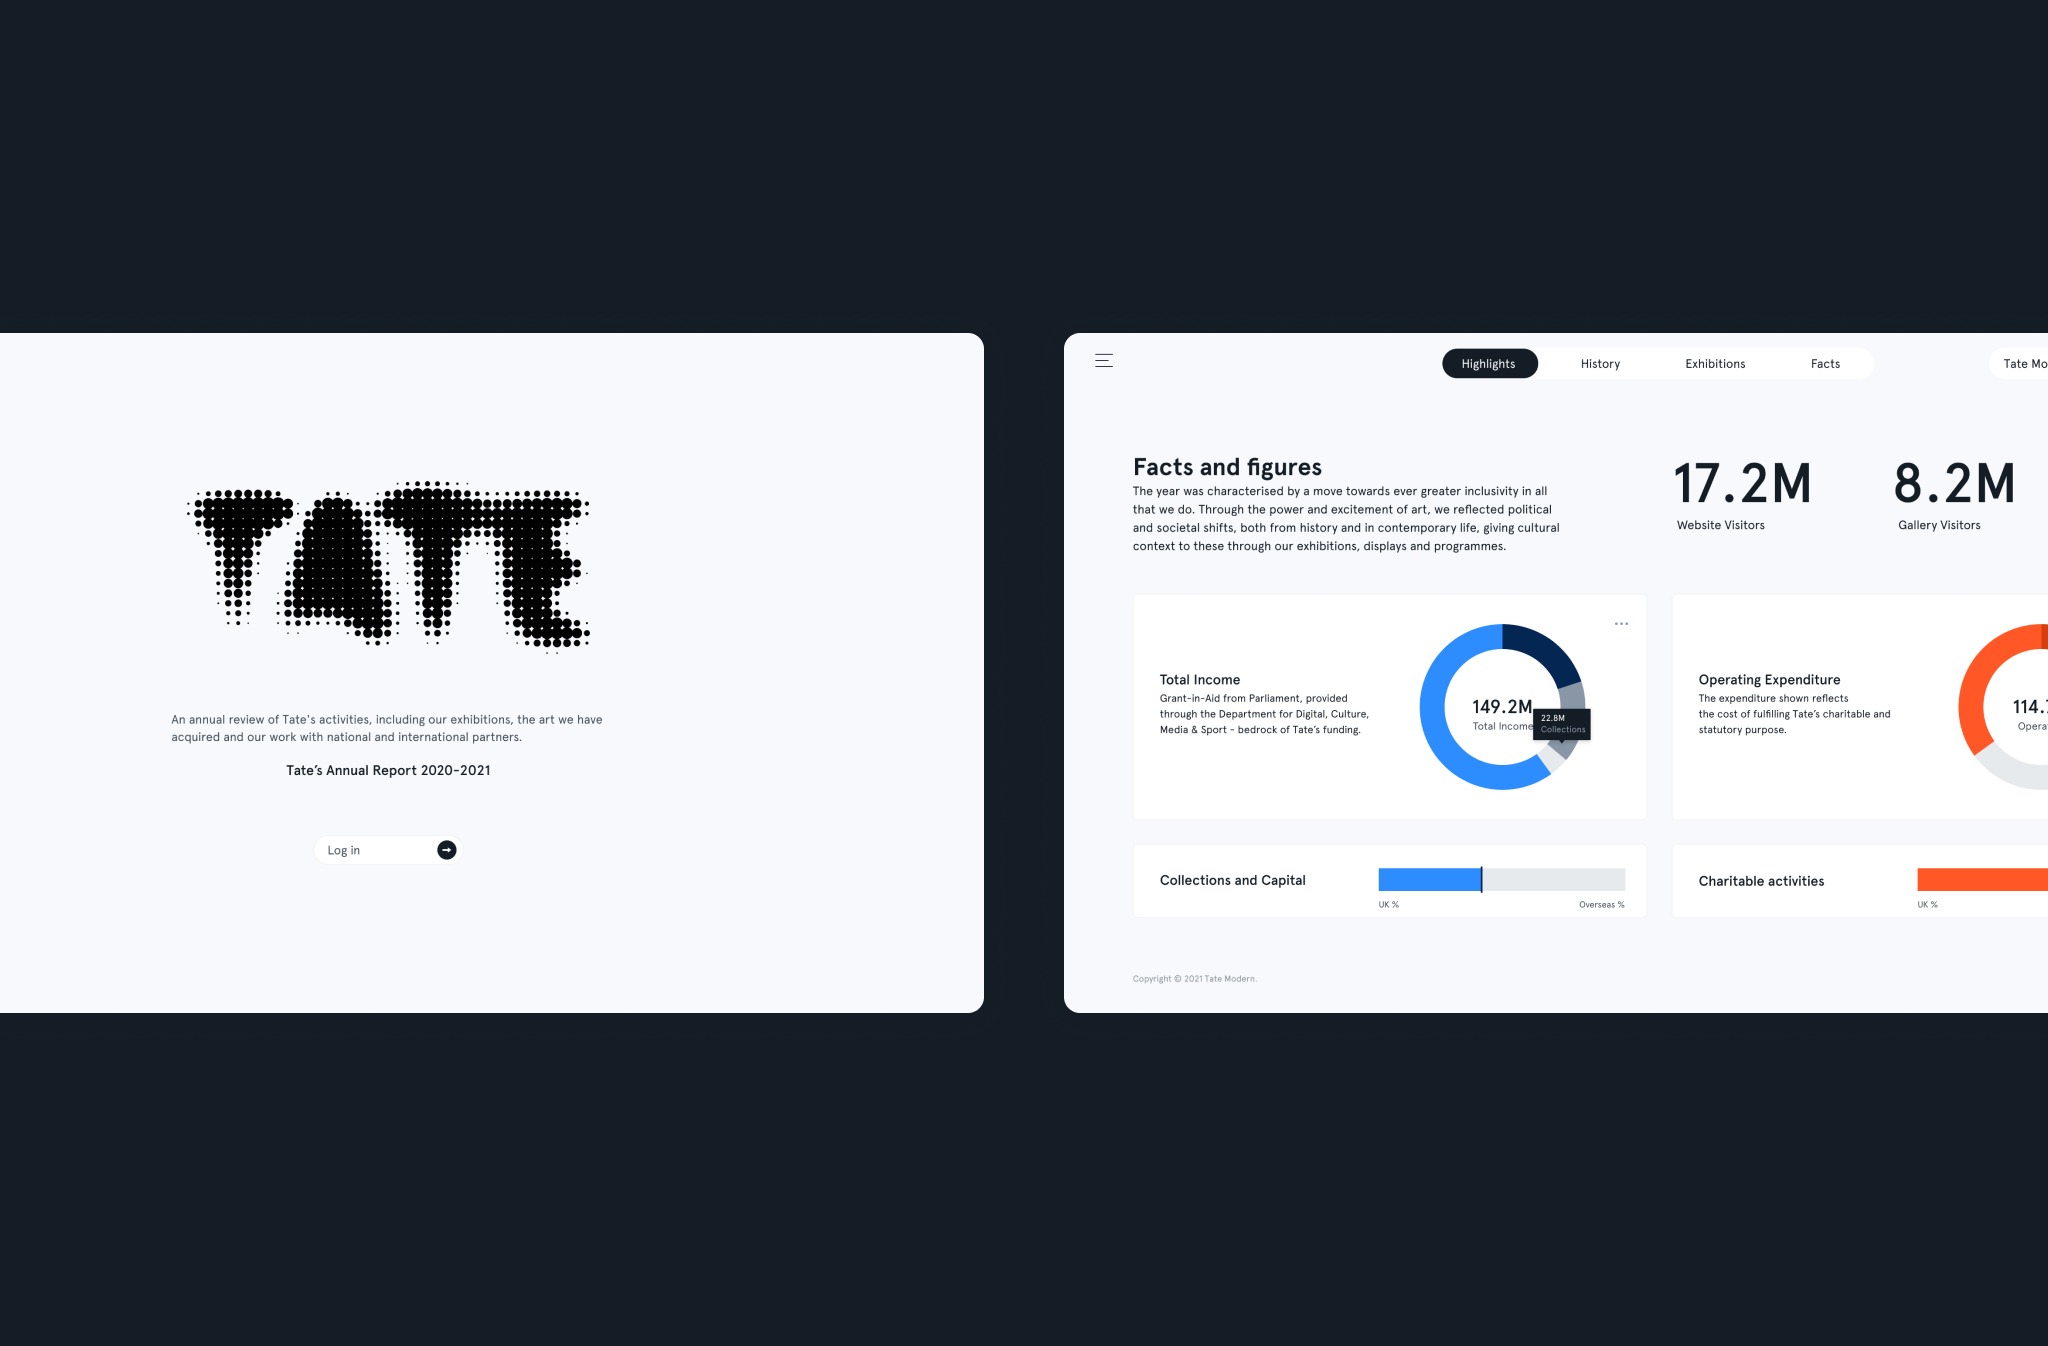
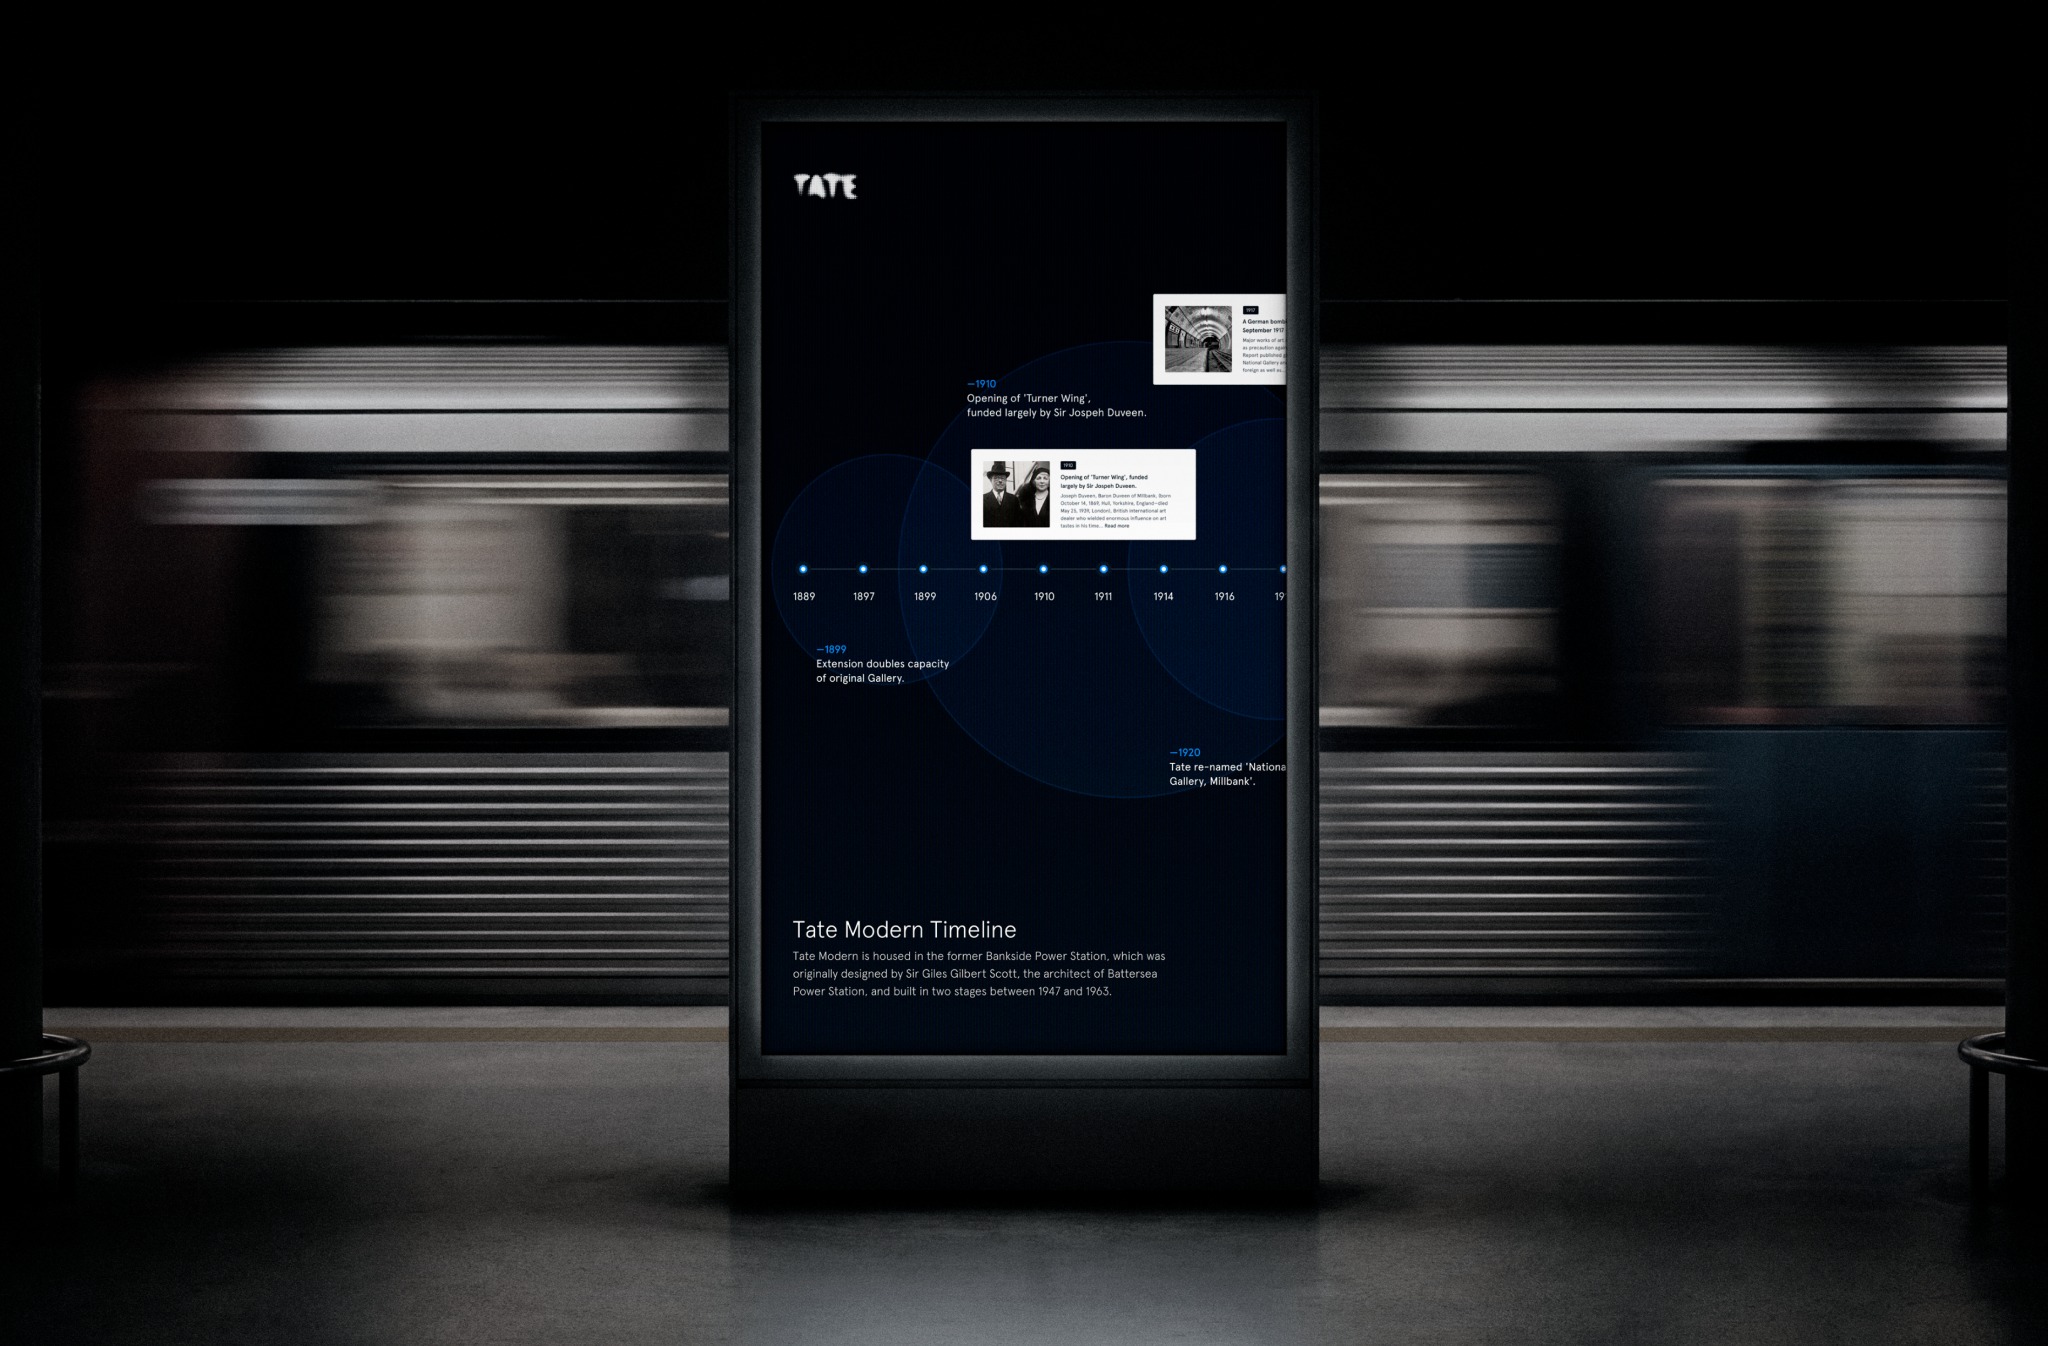
For Tate's 2020–2021 Annual Report, I turned a year of facts and figures into a clear digital experience. Responsive dashboards and data visualisations cover visitors, membership, income and acquisitions on desktop, tablet and mobile. Editorial pages for each gallery and an interactive timeline of Tate's history sit alongside them. The visual language pairs a calm, gallery-like layout with bold blue and orange accents and a halftone version of the Tate wordmark. The same system carries into large-format posters for station platforms.
Support this project

Dmytro voted for this project