
Clutch Lens — World Cup 2026 Sports Analytics Dashboard UI
Project description
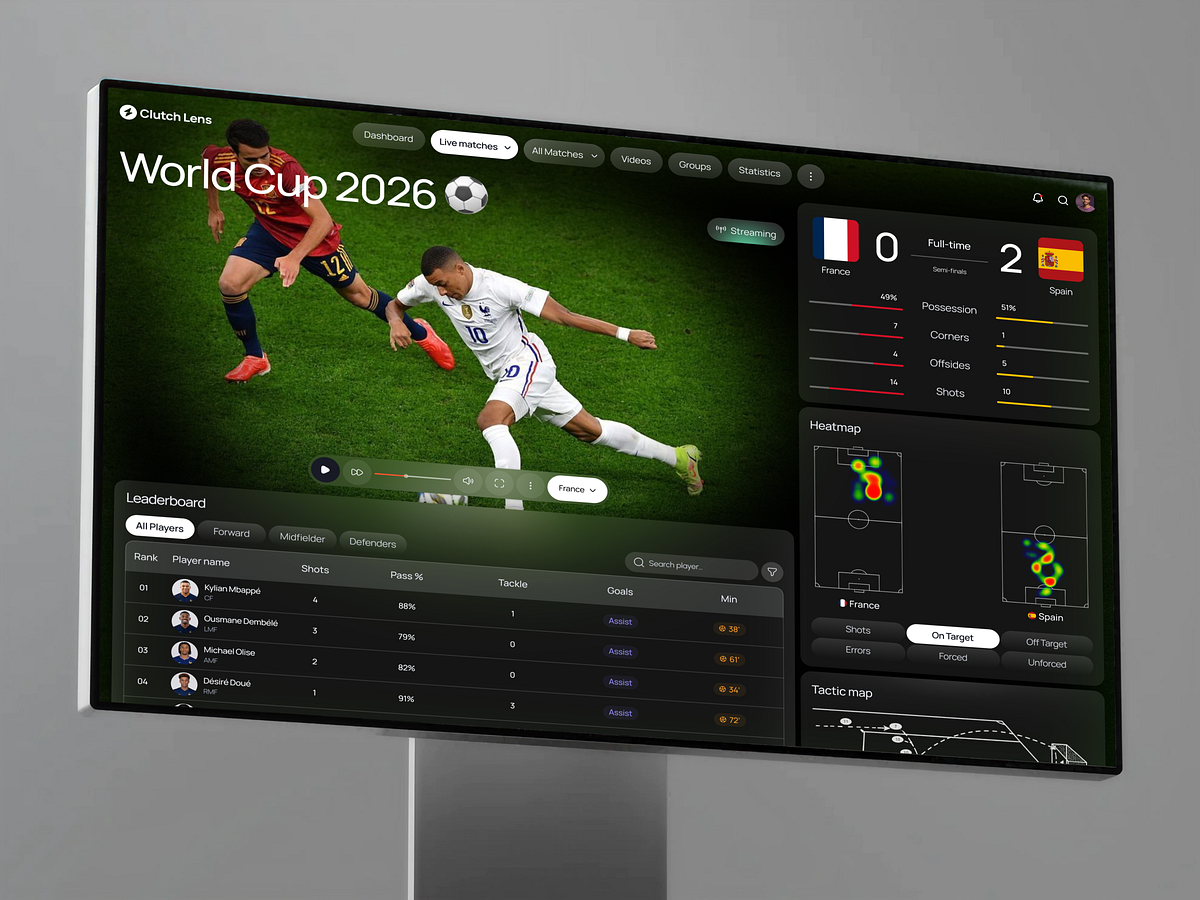
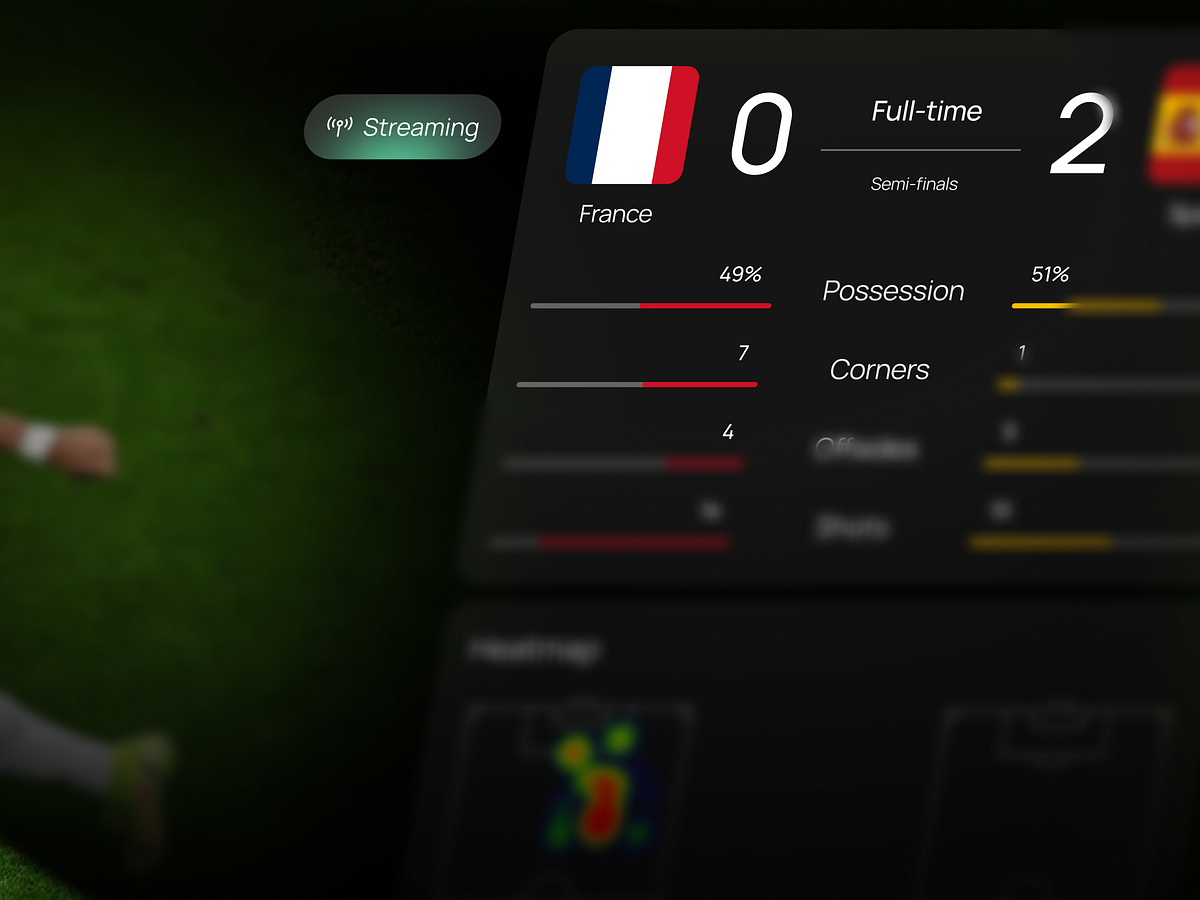
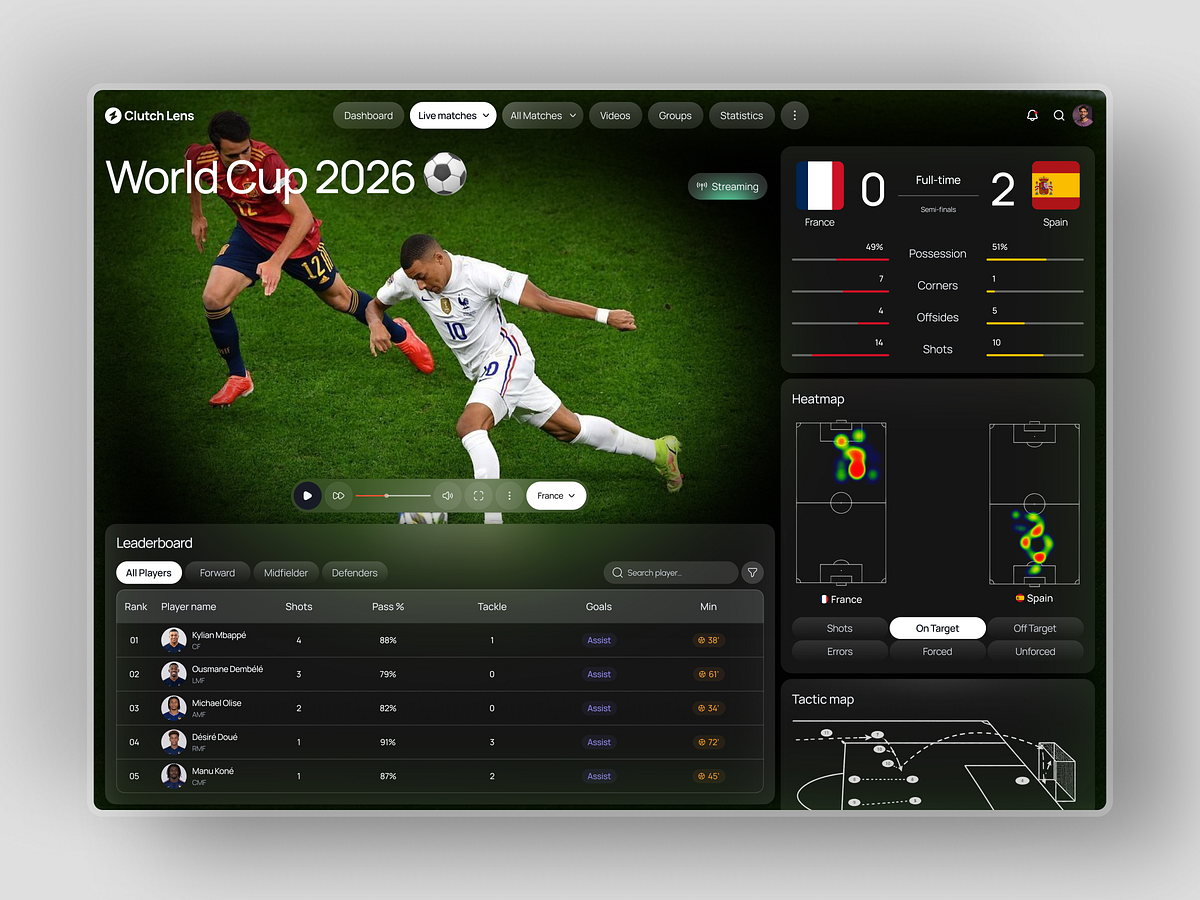
"Live match. Full stats. Tactic map. Heatmap. All on one screen." Clutch Lens a World Cup 2026 sports analytics dashboard that puts the broadcast and the data side by side instead of making you choose between them. France 0 – Spain 2, semi-finals, full-time. The score is there. The possession split is there. The shot heatmaps for both teams are there. The tactic map is already loading below. The player leaderboard filtered by position shots, pass %, tackles, goals, and minutes is the kind of table that turns a casual viewer into someone who actually understands what they just watched. Dark background with pitch-green photography bleeding into the UI. The design doesn't separate the sport from the data. It makes them the same thing.