Financial Dashboard - B2B Sales Pipeline & Revenue Tracking

Project description
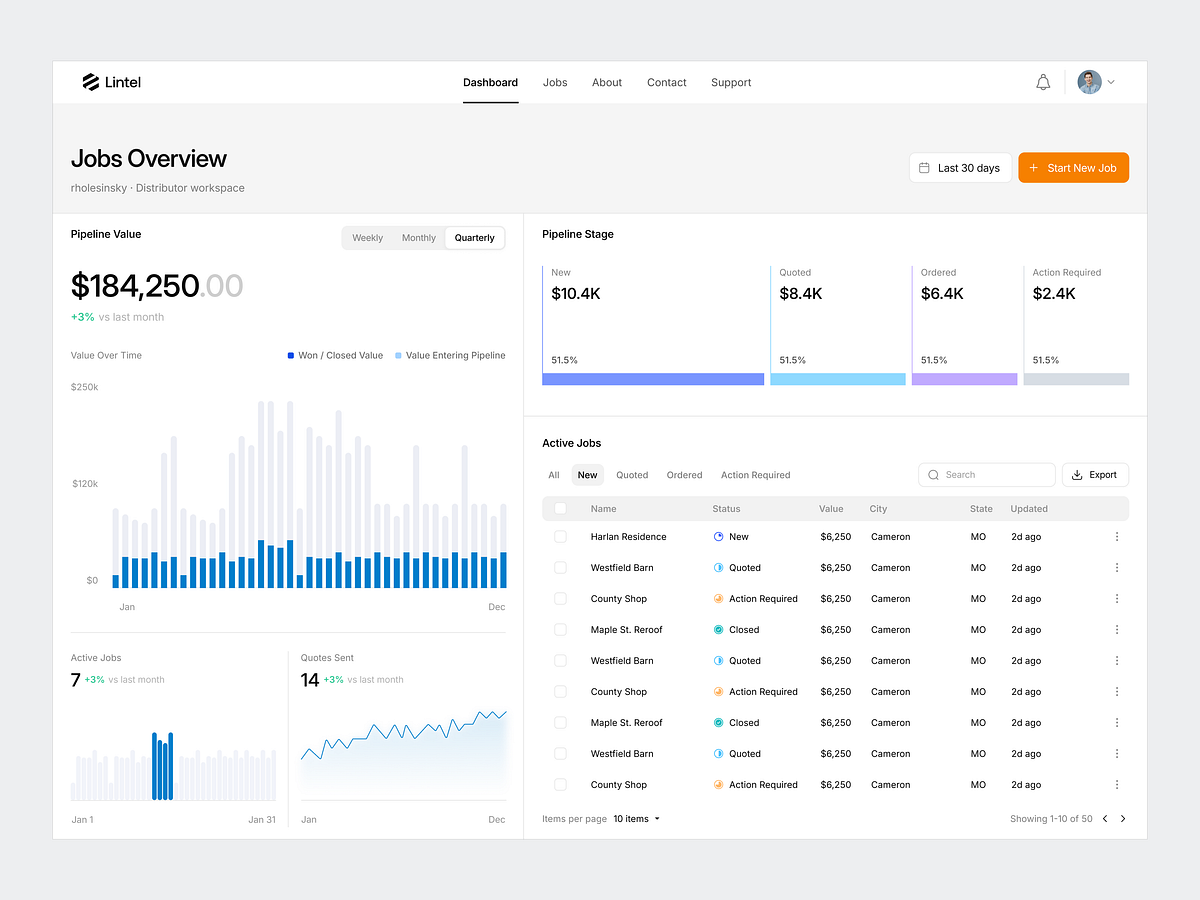
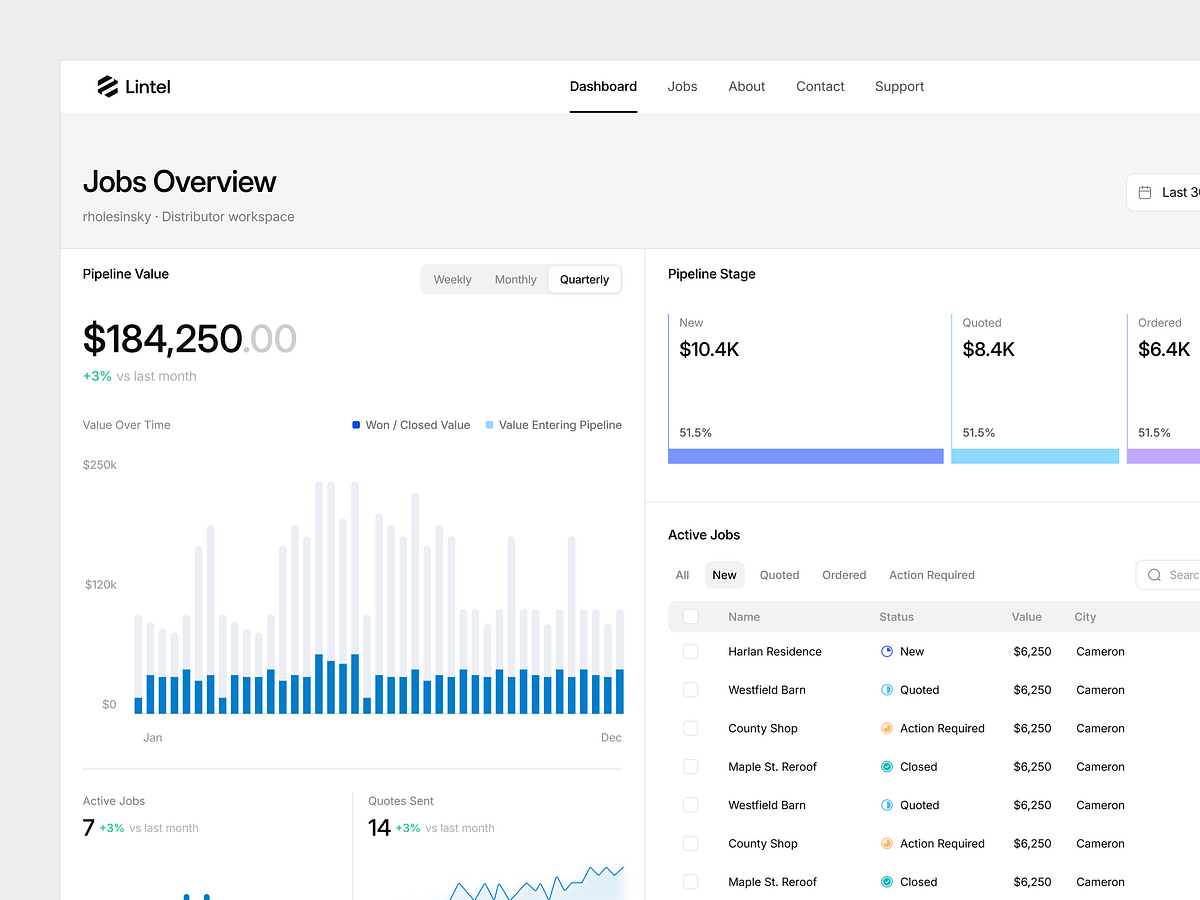
A financial dashboard built around one question: where is the money sitting right now?Lintel is a B2B SaaS platform where distributors track every job from first quote to closed deal. Pipeline value, stage-level breakdown and revenue trend all read from a single screen before you drill into individual rows.Inside the shot:- Pipeline value with weekly / monthly / quarterly toggle- Revenue split into won value vs. value entering the pipeline- Stage breakdown across New, Quoted, Ordered and Action Required- Active jobs table with status filters, search, export and pagination- KPI cards with inline sparklines for volume and quote velocityThe hard part was density. A distributor runs 50+ open deals at once, so the layout had to surface financial health at a glance without burying the row-level detail their team actually works in.Blue carries the data, grey carries context, orange is reserved for the single primary action on the page.Full case study coming. Currently taking on 0→1 product work for funded startups.Press "L" if you'd cut it differently.
Support this project
Upvote