Sales Dashboard UI for a B2B SaaS: Pipeline & Analytics Overview

Project description
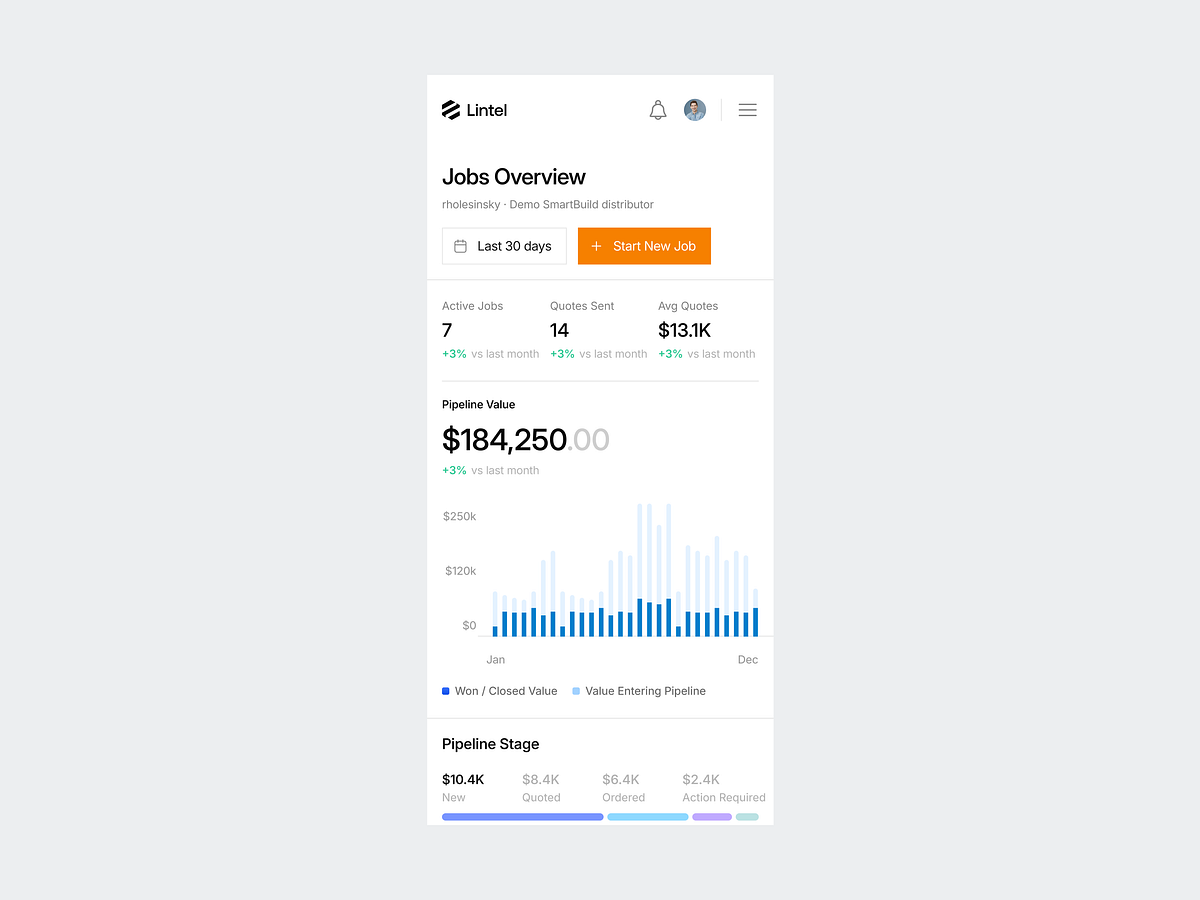
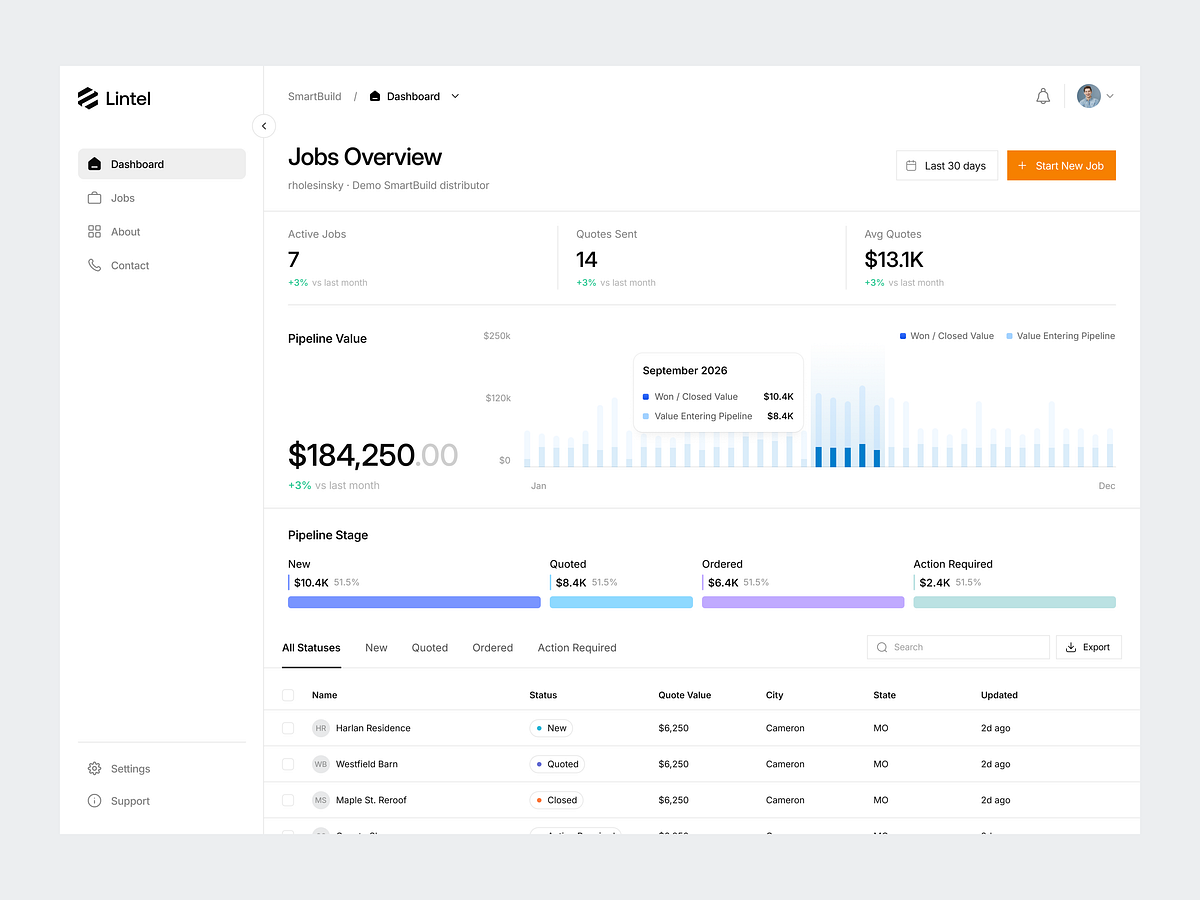
Sales Dashboard UI for a B2B SaaS: Pipeline & Analytics OverviewSales dashboard design for a B2B SaaS web app, built to give sales teams a single view of what matters: active jobs, quotes sent, pipeline value over time, and a stage breakdown from new lead to closed deal.The stacked bar chart separates value entering the pipeline from won revenue, so sales trends are readable at a glance. Below, a filterable table keeps day-to-day work one click away.Designed fully responsive, with the mobile layout rethought rather than squeezed: KPIs stack, the chart stays legible, and pipeline stages compress into a compact summary.Clean data visualization, clear hierarchy, and a single accent color doing the heavy lifting.Interested in a sales dashboard or product design for your SaaS? Let's talk.
Support this project
Upvote