

Analytics UI Dashboard
Project description
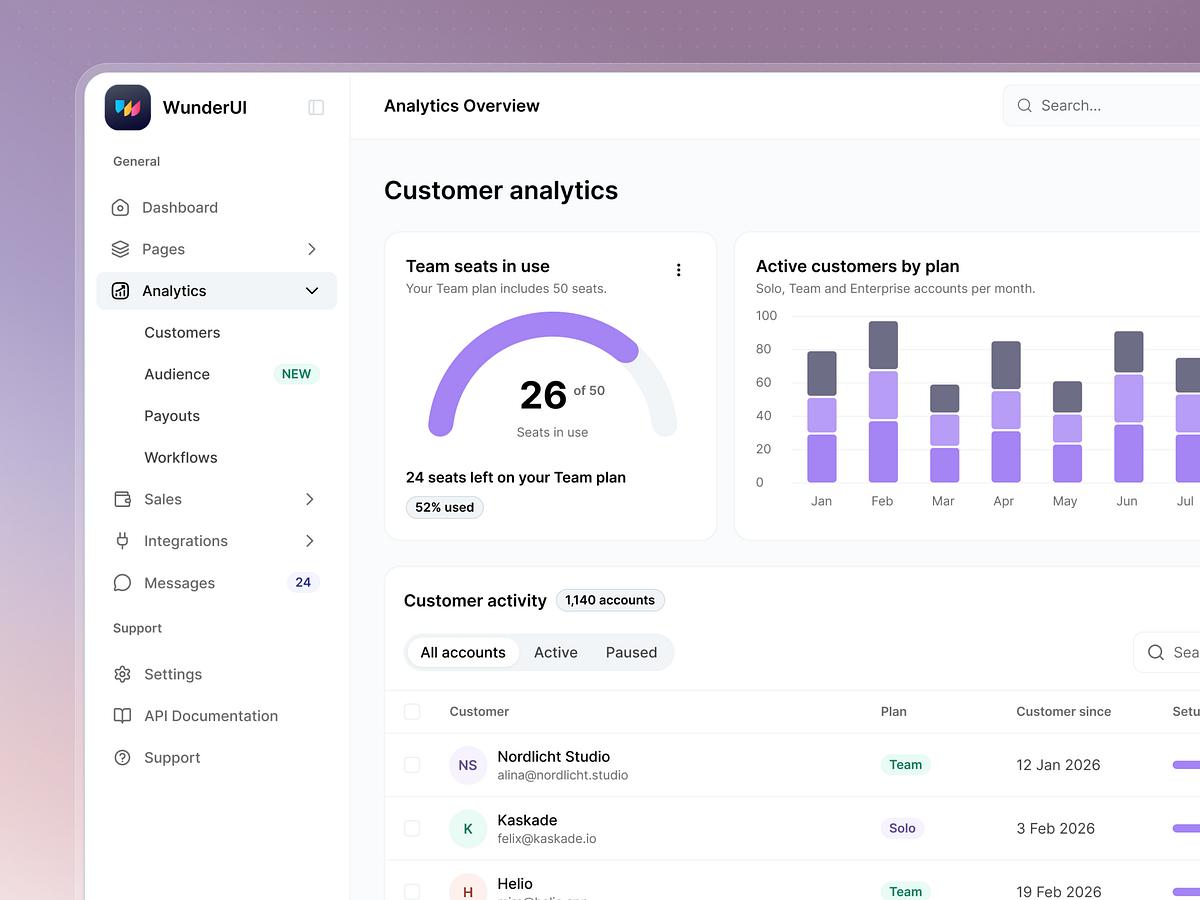
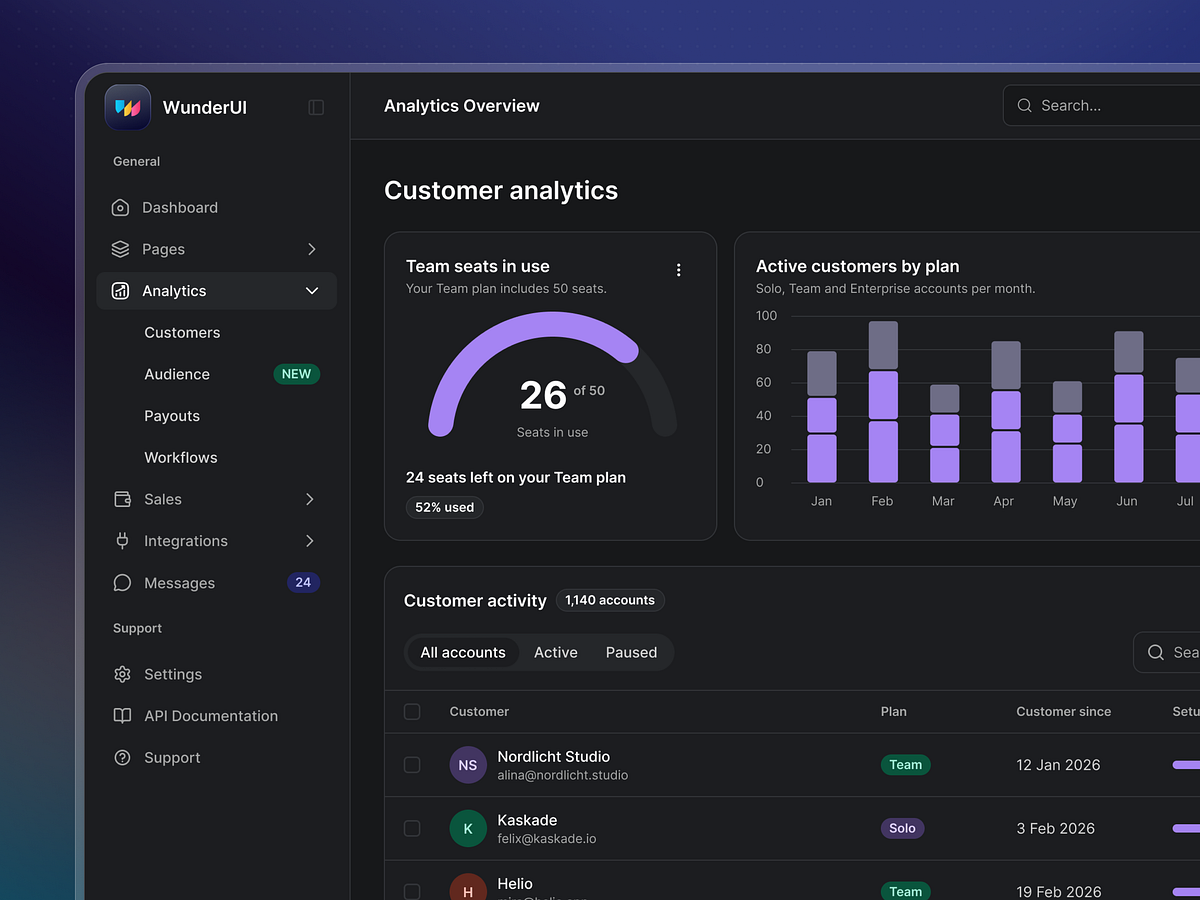
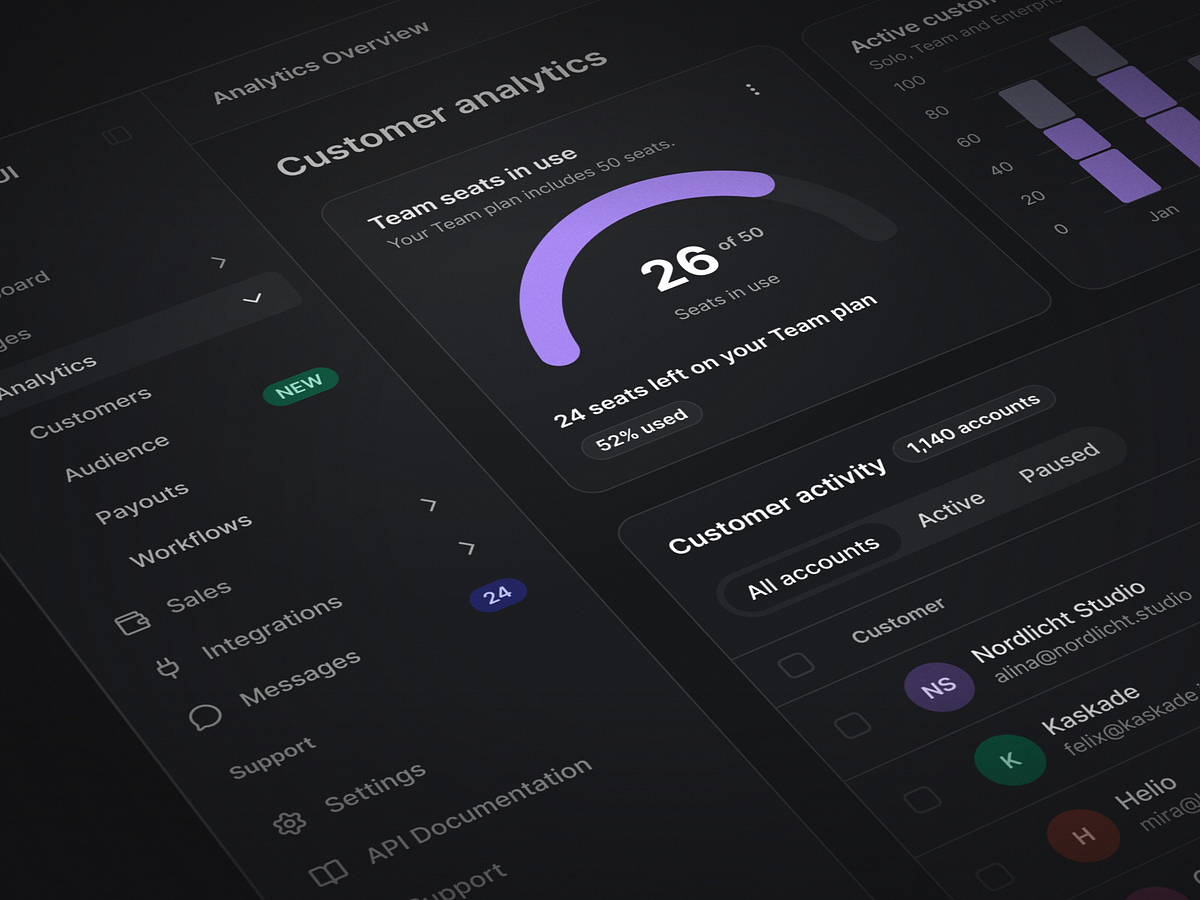
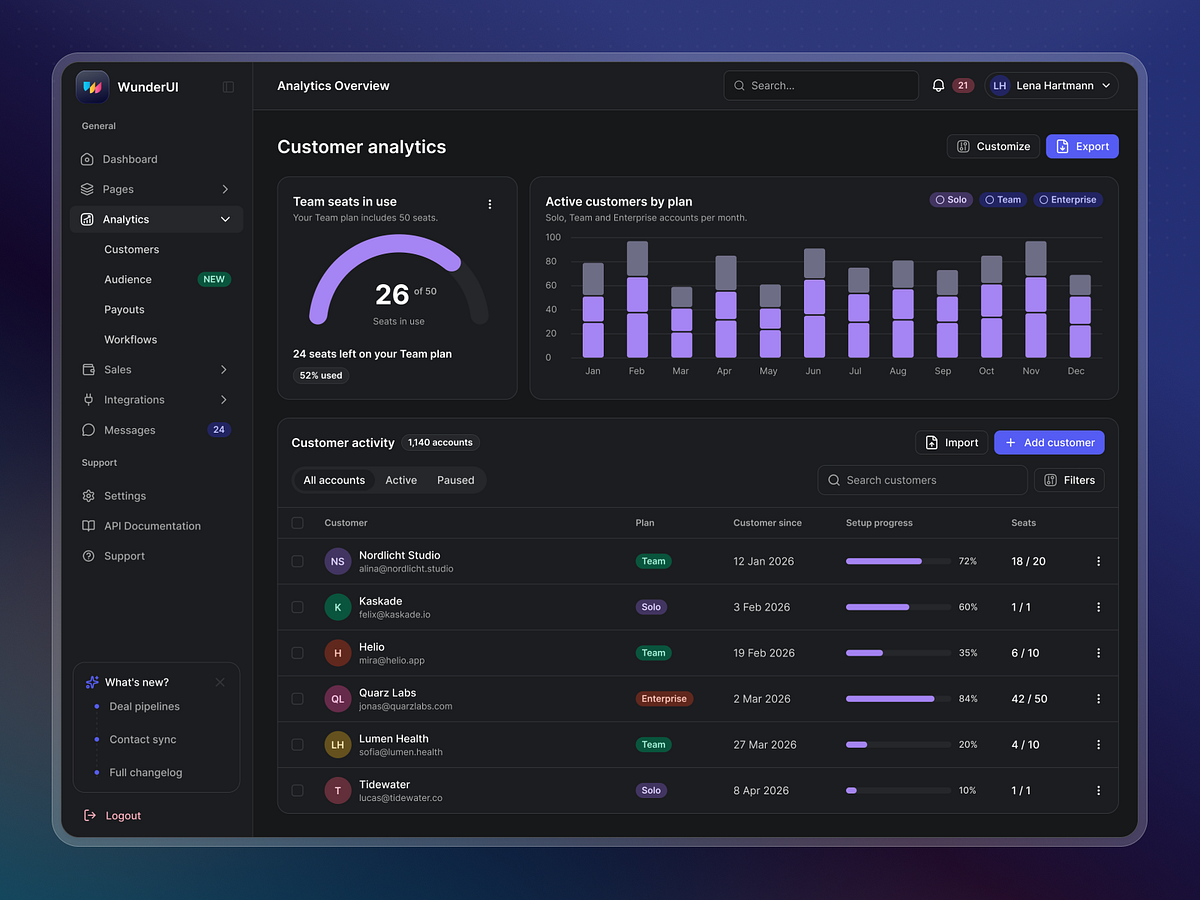
✨Made with WunderUI A clearer view of your SaaS performance. This dashboard concept brings key metrics, trends, and reports into a focused workspace, with a visual hierarchy designed to make complex data easier to explore. Created with the WunderUI design system, it combines reusable components, balanced spacing, and consistent typography—a flexible foundation for building connected analytics experiences in Figma and React. What do you think of the design? Share your feedback below. Explore WunderUI https://wunderui.com/
Support this project
WunderUI voted for this project