
Operations Dashboard — Revenue & Activity
Project description
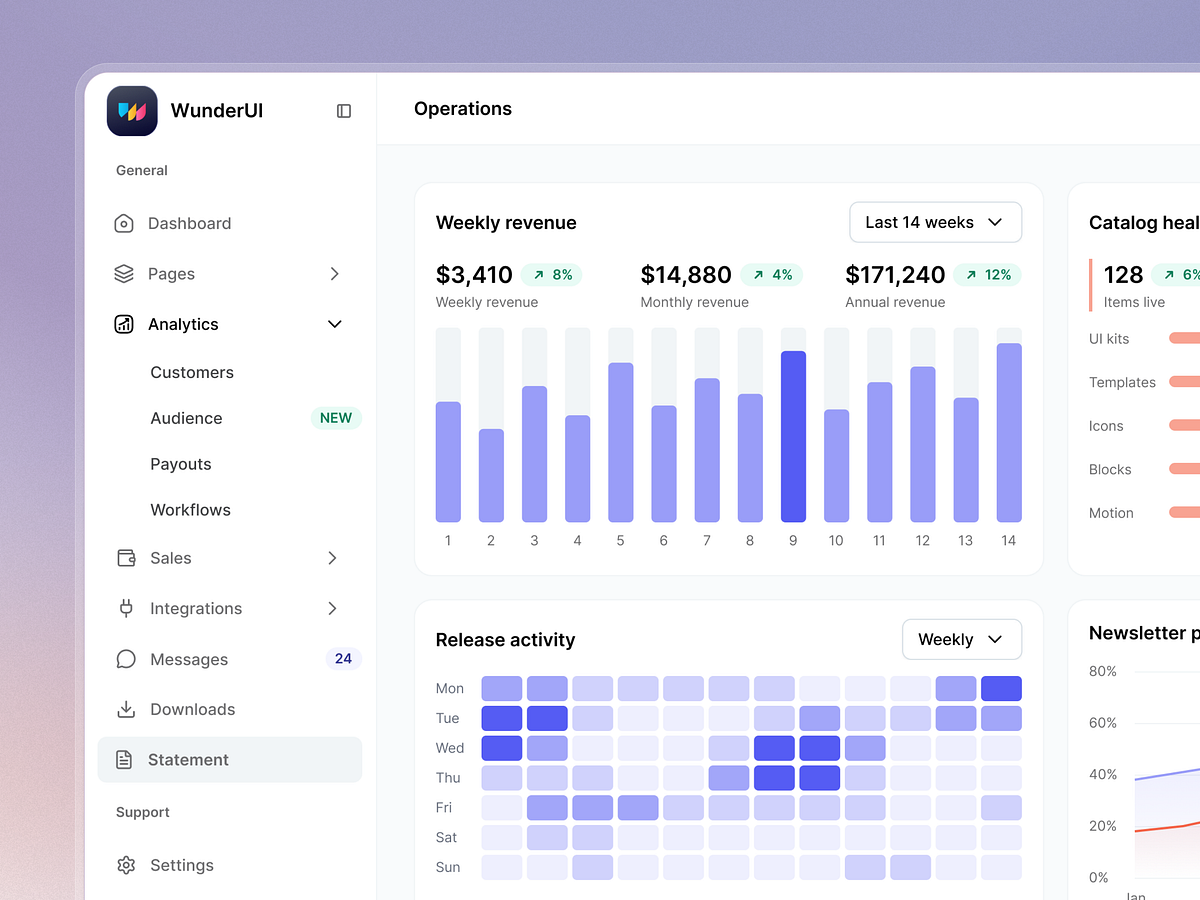
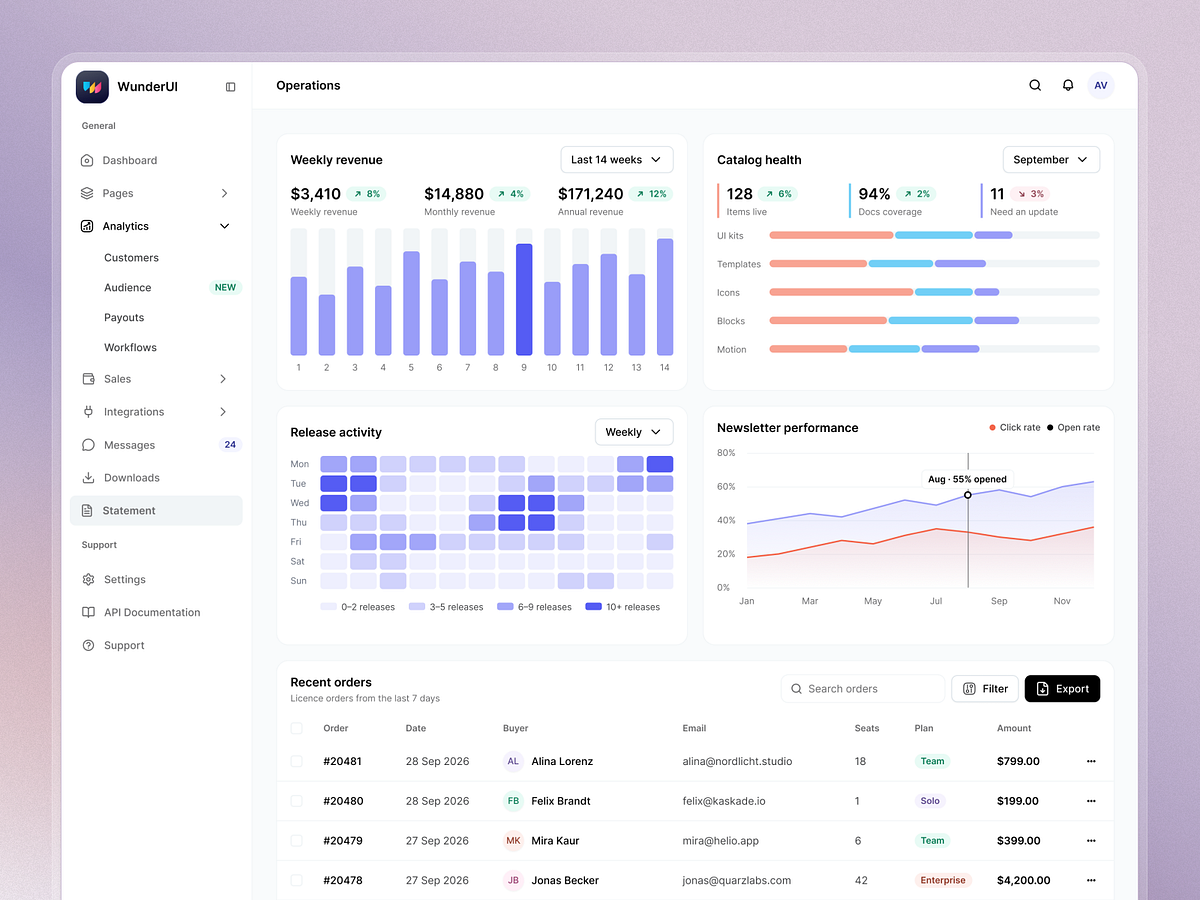
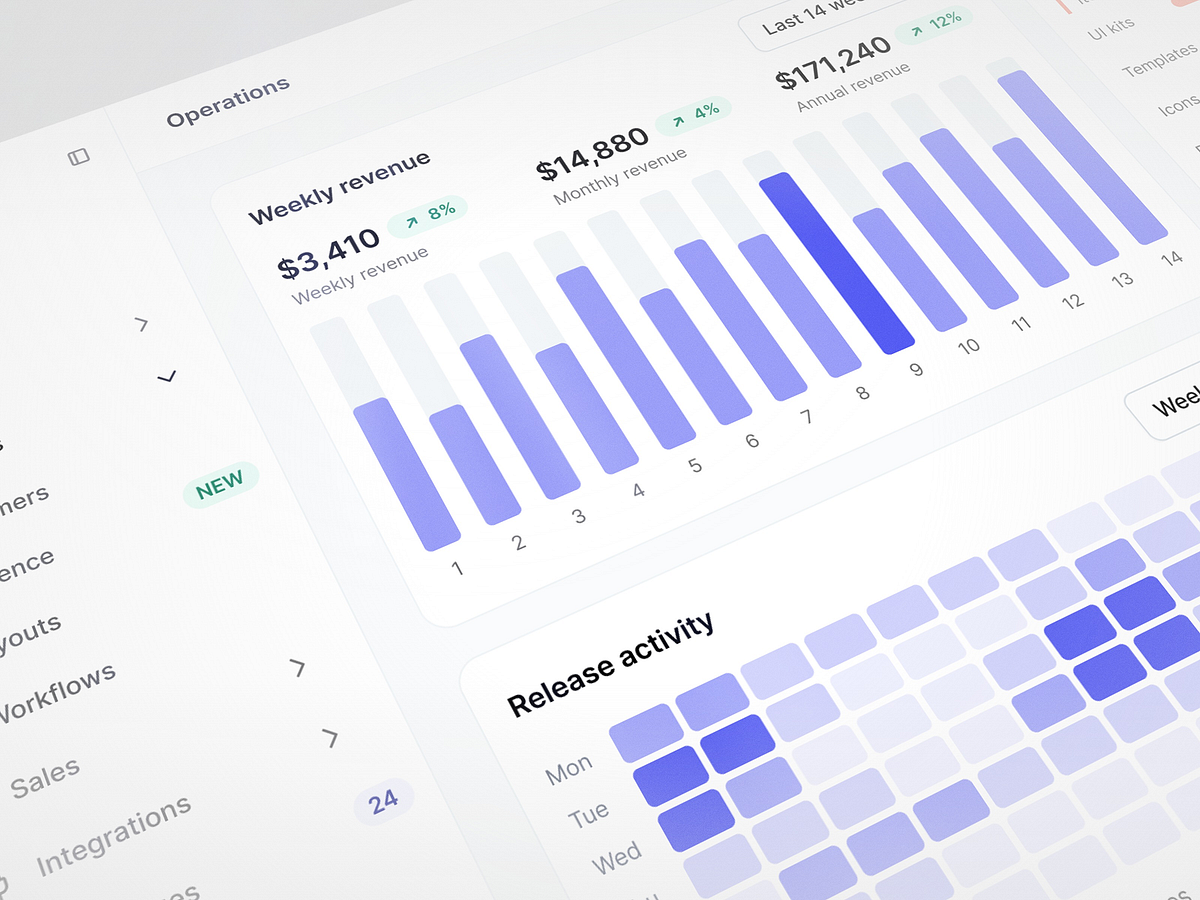
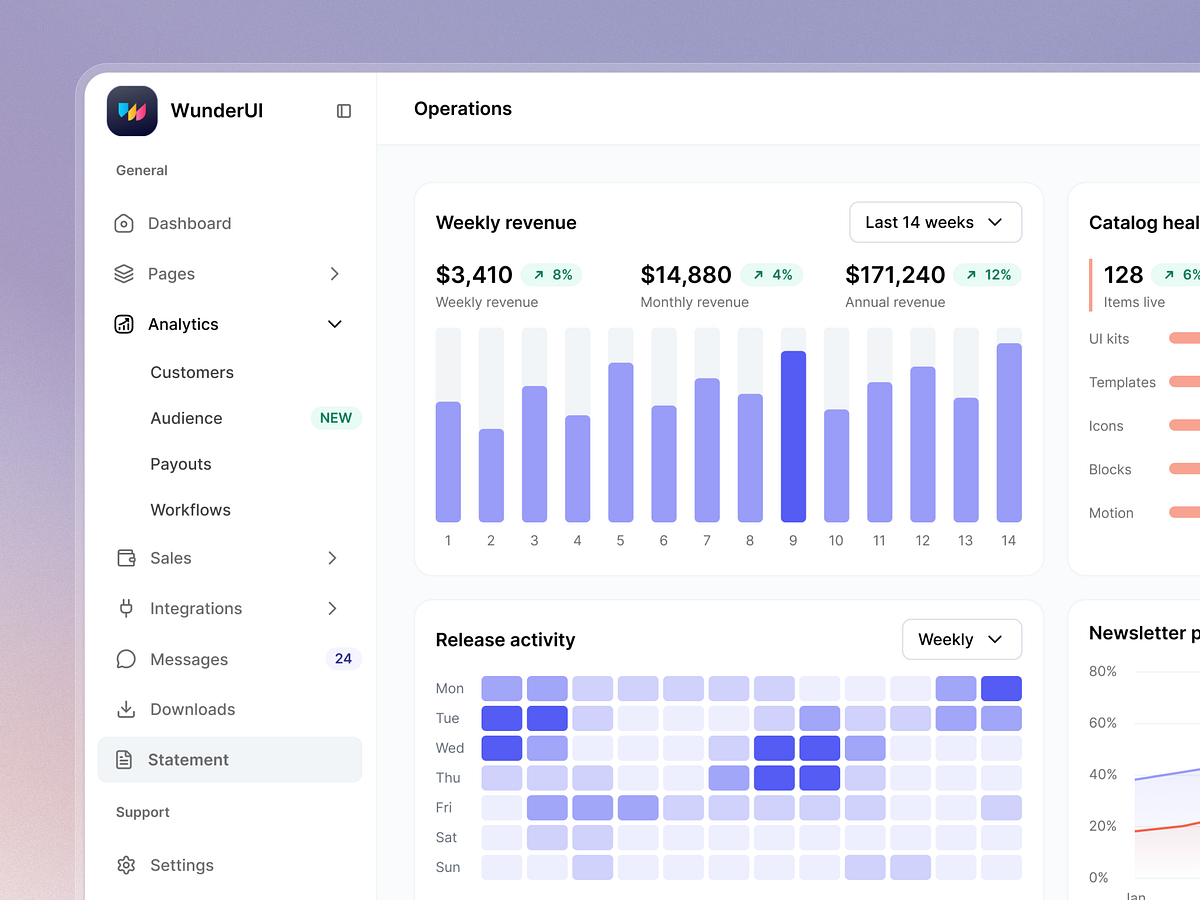
✨Made with WunderUI A fresh look at commerce analytics. Revenue trends, customer activity, and invoice details come together in a dashboard designed for quick scanning and deeper exploration. Soft gradients add color to the charts, while neutral surfaces and clear typography keep the numbers in focus. Designed in Figma with WunderUI, using reusable components to bring consistency across every view. What do you think of the gradient chart treatment? Let me know below. https://wunderui.com/