Finance Analytics Dashboard

by Atiqur Rahman · Mar 2026
shot
Project description
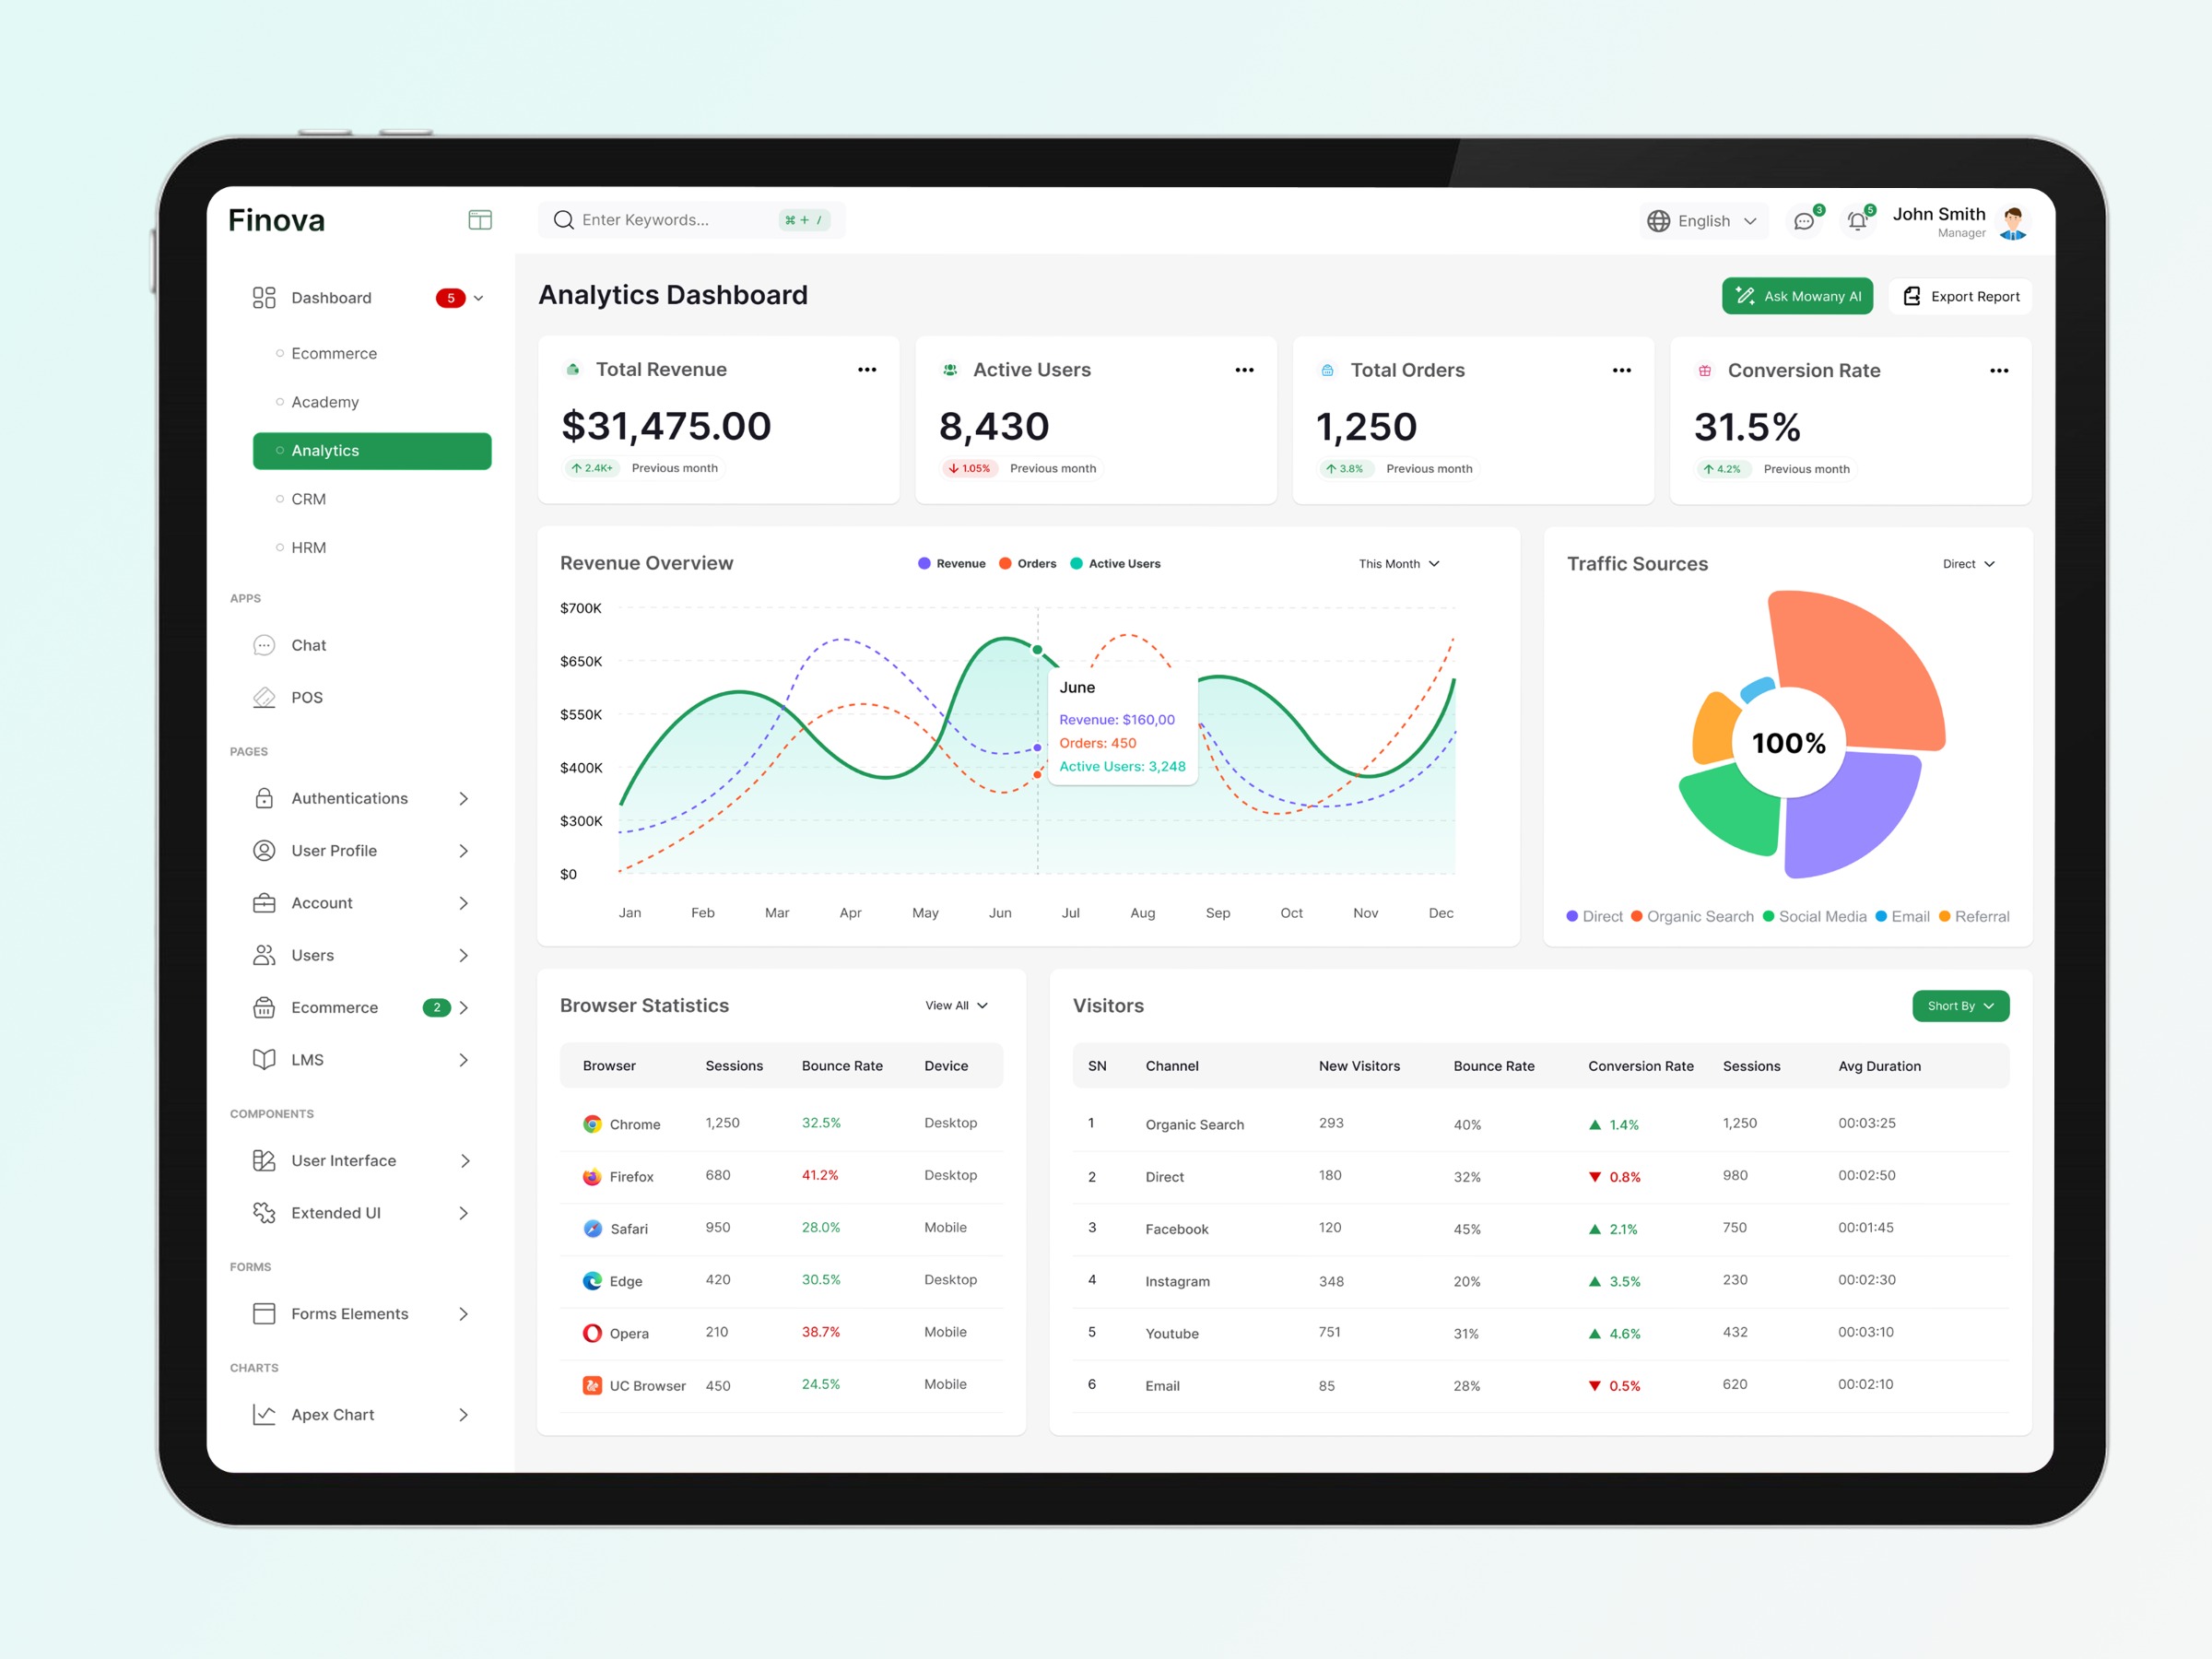
The Finova Analytics Dashboard offers a clean, intuitive interface to monitor revenue, user activity, and orders in real-time. With interactive charts, detailed visitor insights, and traffic source analysis, it empowers businesses to make data-driven decisions efficiently. 💰 Real-time Revenue, Orders, Active Users, and Conversion Rate tracking 📈 Interactive Revenue Overview line chart 🌐 Comprehensive Traffic Sources visualization 🖥️ Browser Statistics with sessions, bounce rates, and device type 👥 Detailed Visitor Analytics with conversion and session insights 📤 Exportable reports and 🤖 AI-assisted analytics via Ask Mowavy AI
Support this project
Upvote