Fintech Finance Dashboard | Expense & Income Analytics UI

by Orbix Studio · Jan 2026
VIDEO
Project description
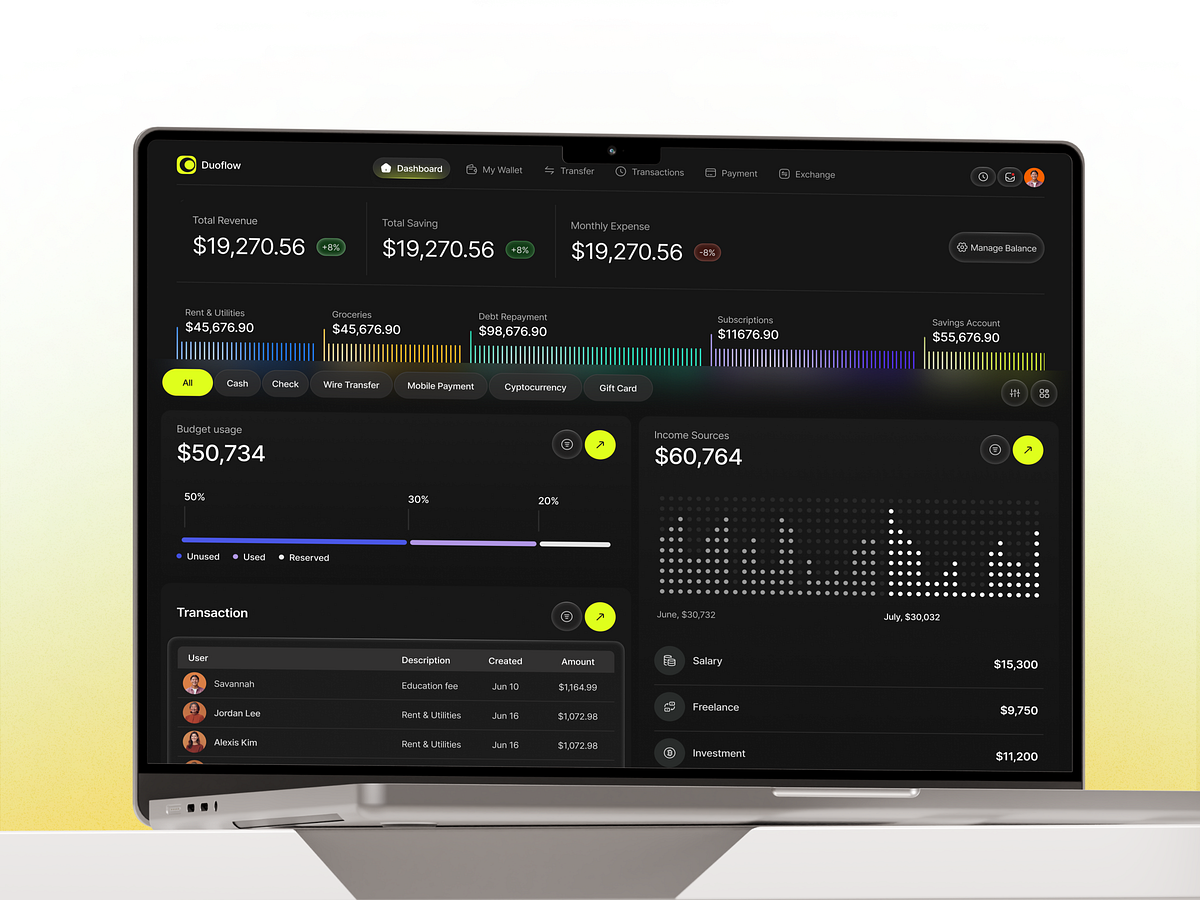
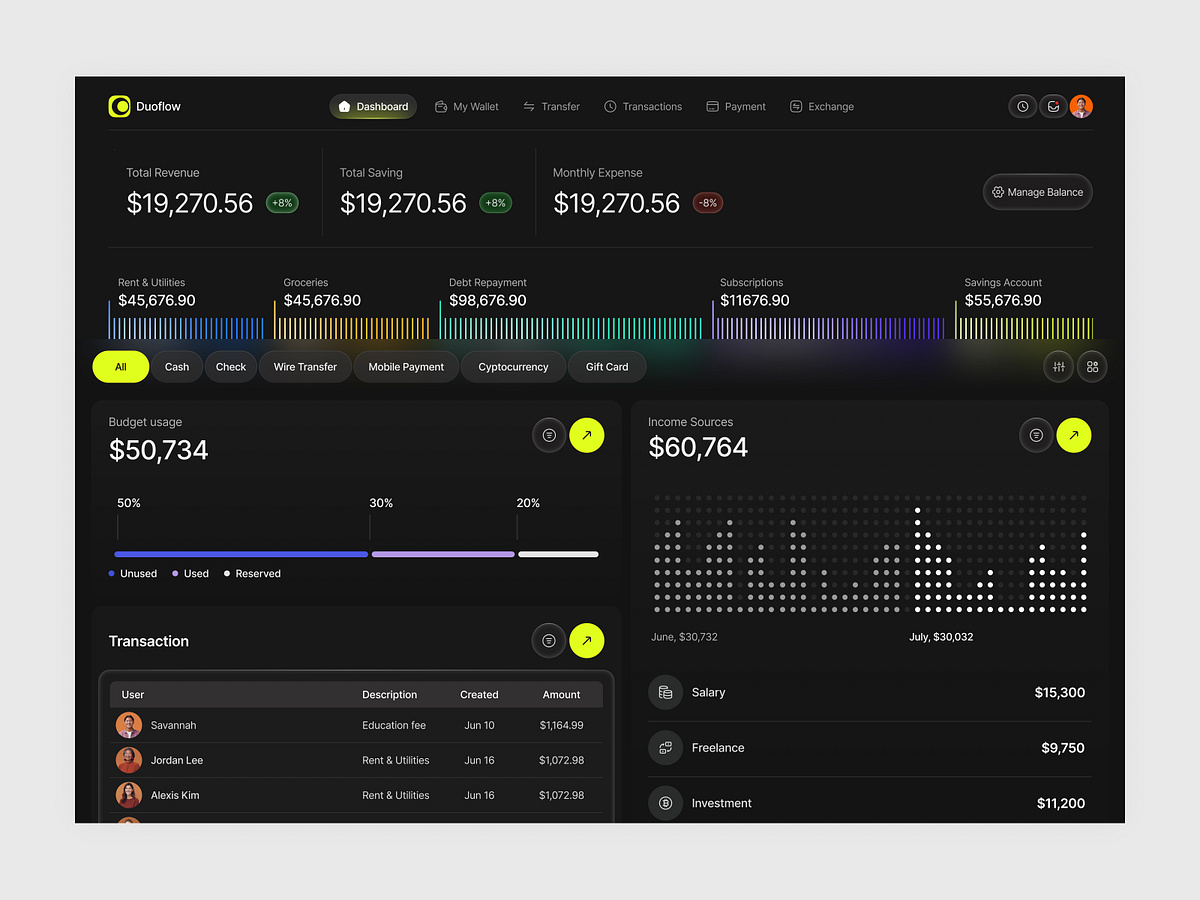
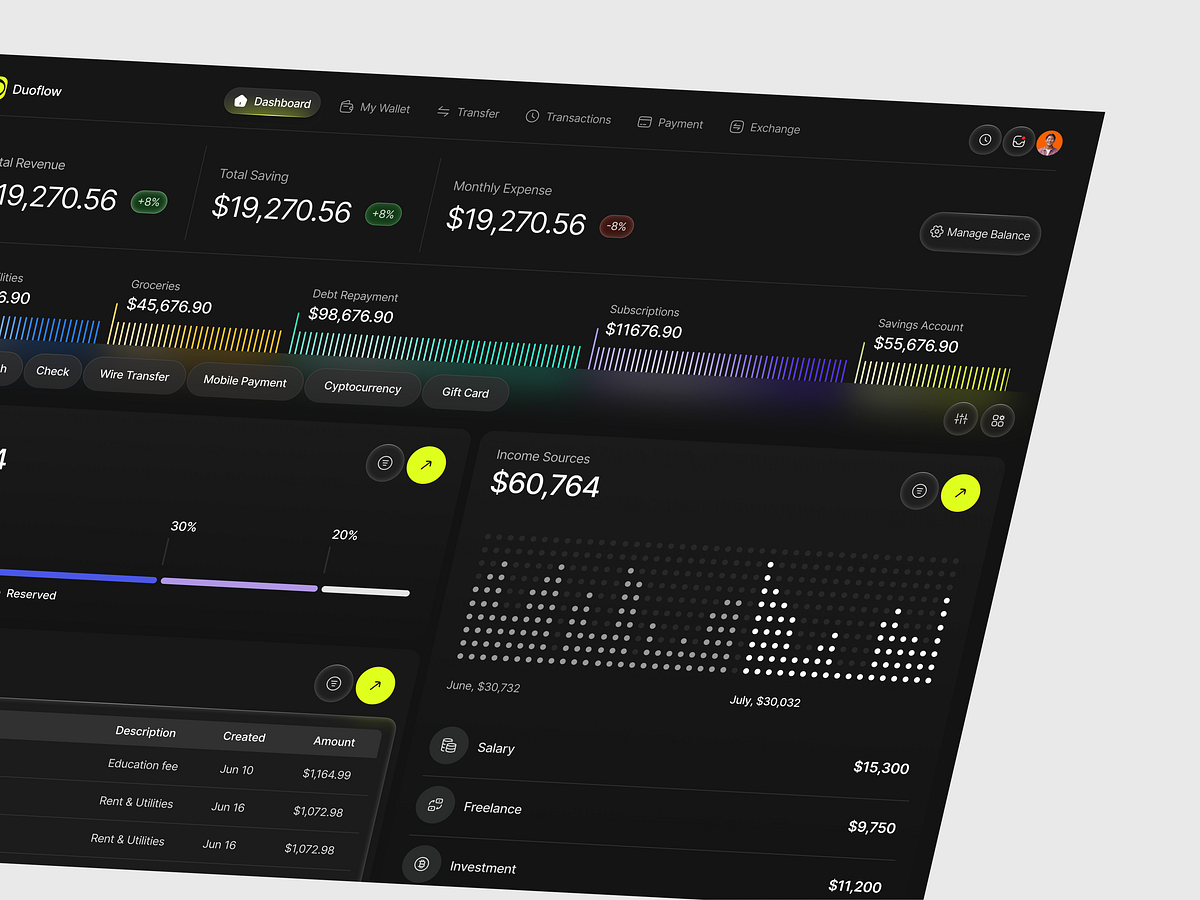
Financial dashboards often overwhelm users with numbers and noise. This concept focuses on turning complex financial data into readable, actionable insight. Most finance dashboards suffer from dense layouts, unclear hierarchy, and poor visual separation between income, spending, and savings. This dashboard organizes financial data into structured sections with clear visual priorities, allowing users to track revenue, expenses, and budgets without friction.
Support this project
Upvote