Social Media Growth & Analytics Dashboard

Project description
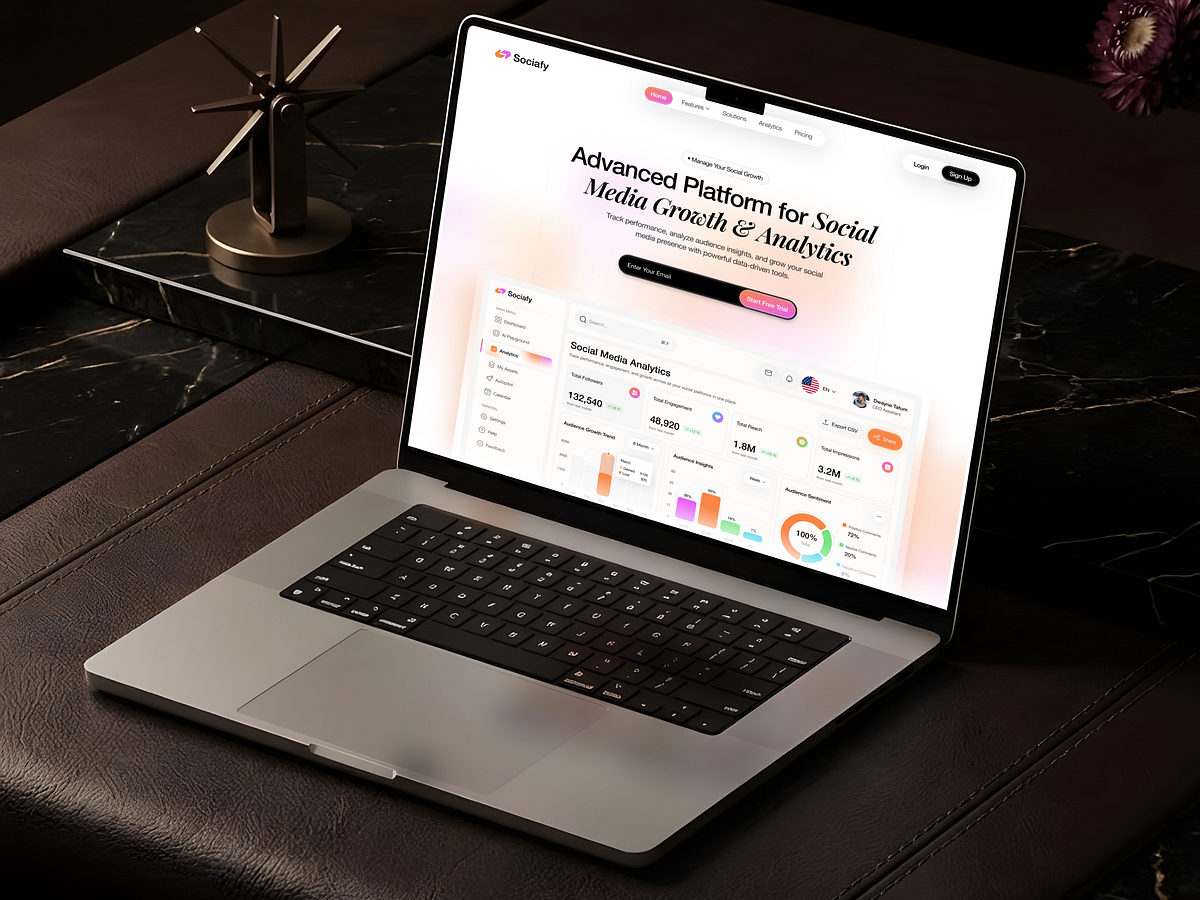
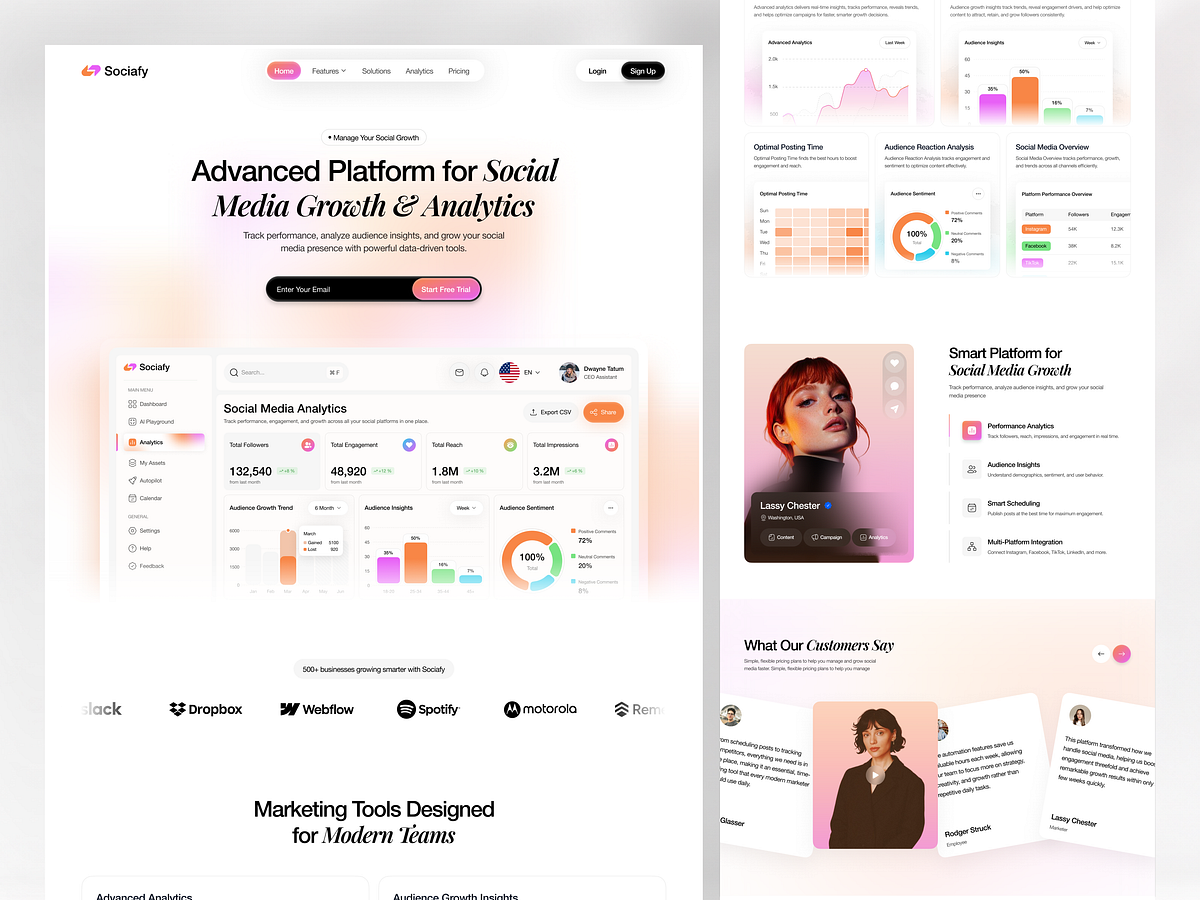
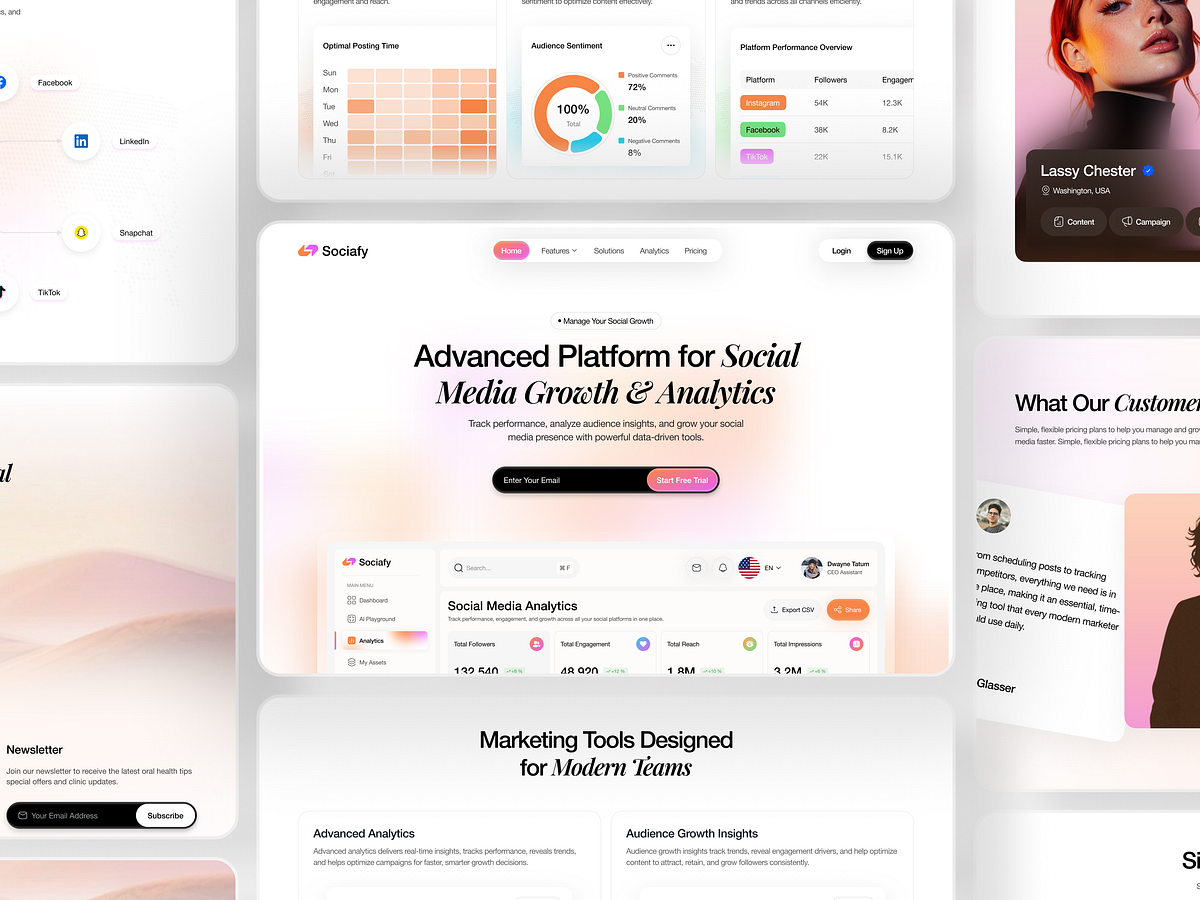
Tracking your social media success shouldn't feel like doing complicated math homework. Usually, follower counts, engagement rates, and optimal posting times are scattered everywhere, making it super hard to actually know what to do next. We designed this Sociafy dashboard to fix that. Instead of confusing spreadsheets, it puts everything on one clean screen. Want to see if your audience is happy? The Sentiment ring chart shows you instantly. Need to plan your schedule? The Optimal Time calendar makes it easy to see when to share. The design is kept modern with a dark theme that makes the colorful data pop. We used clear sections and simple cards so you can spot your growth stats in seconds, without feeling overwhelmed. Every detail is designed to make analytics feel less stressful and actually useful for growing your brand.
Support this project
Upvote