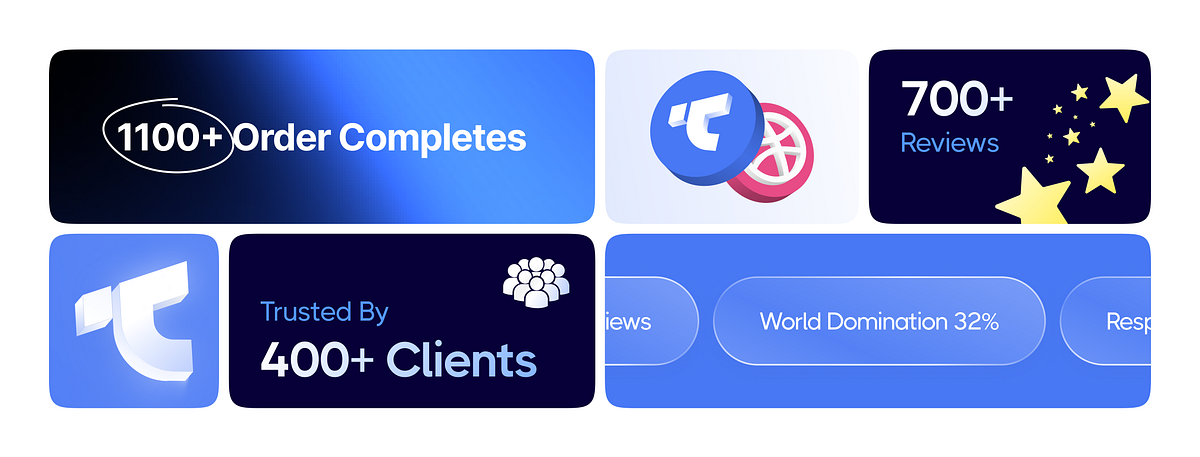
Dashboard UI UX Design Recap with Motion Graphic
VIDEO
Project description
This week at Taqwah, we brought motion to data. From e-bike analytics to real estate and healthcare dashboards, every frame reflects how interaction, color, and movement turn complex insights into intuitive experiences. This motion recap highlights how we transform dashboards into dynamic stories of usability and performance.

Support this project
Upvote